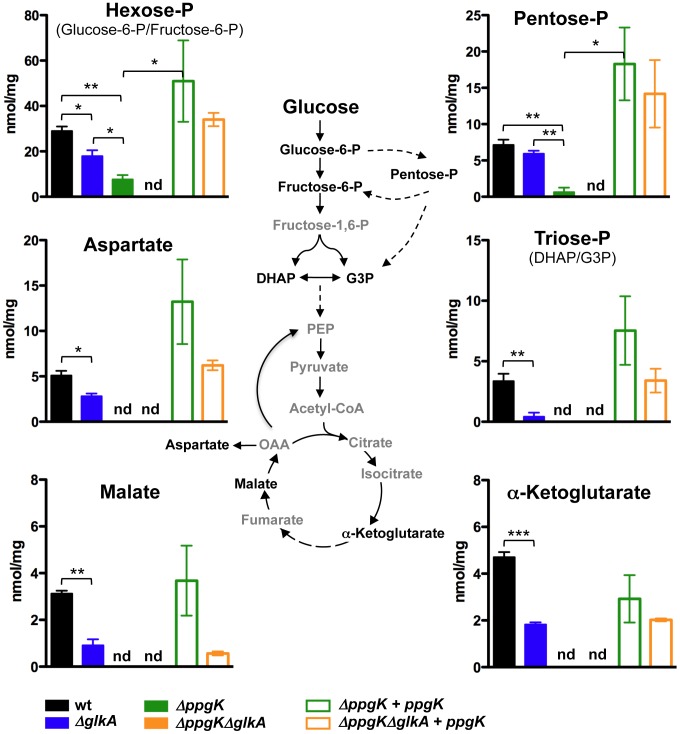
Figure 3. Both PPGK and GLKA mediate glucose incorporation into central carbon metabolism.
Schematic illustration of the metabolic pathways studied using carbon tracing analysis and isotopic incorporation of U13C-glucose into the intracellular pool of selected metabolites. Isotopic labeling is indicated on the y-axis as nmol labeled/mg protein/16 h labeling interval. Each bar represents the mean of three sample replicates and error bars indicate standard deviation from the mean. nd = not detected. * P≤0.05, ** P≤0.01, *** P≤0.001. Data are representative of two independent experiments.

