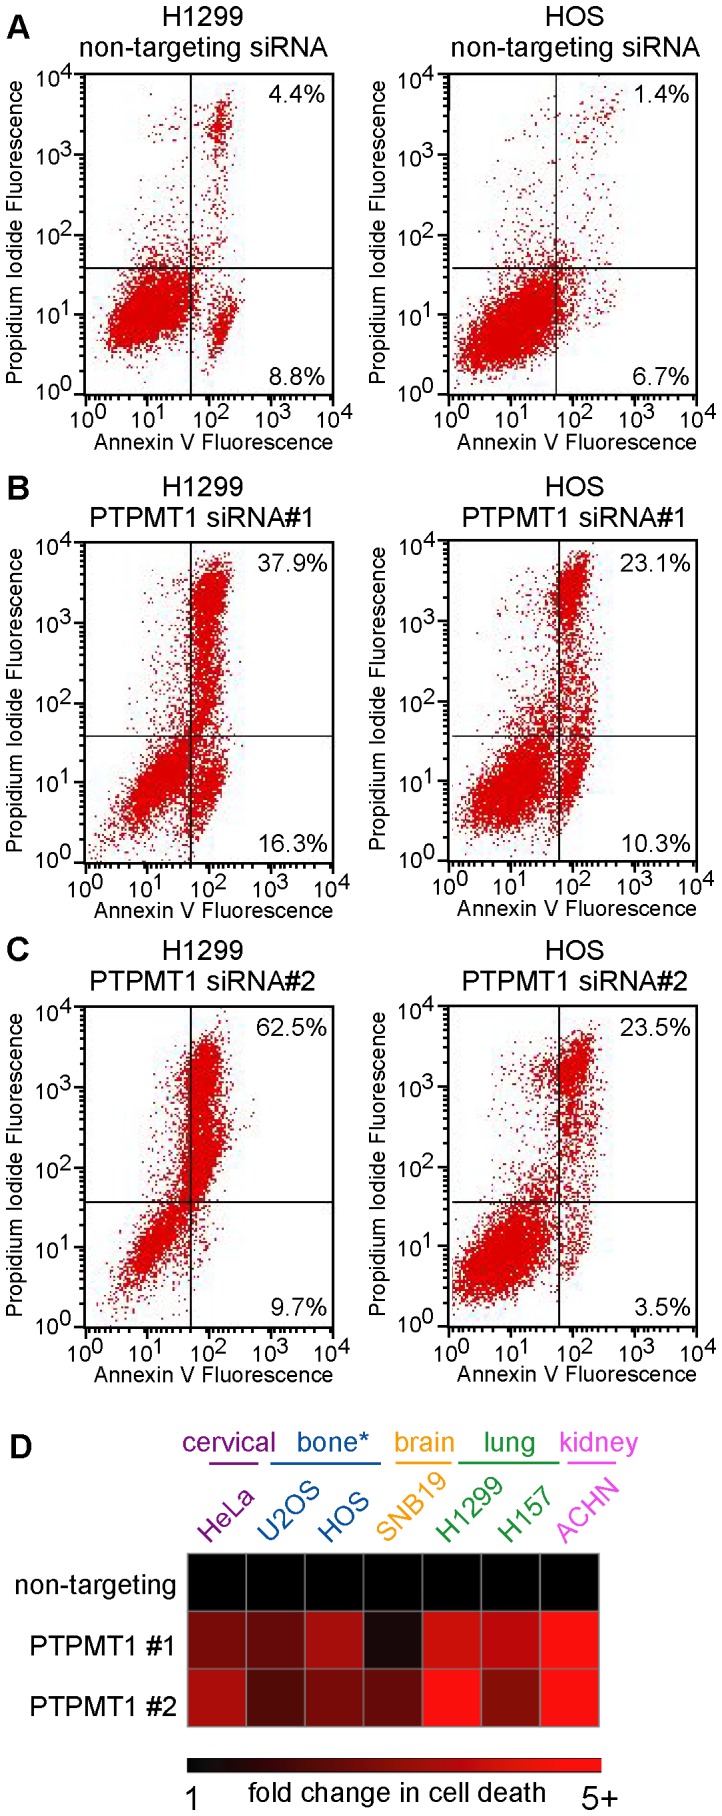
Figure 3. PTPMT1 knockdown induces apoptosis in many cancer cell lines.

(A–C) The lung carcinoma cell line H1299 and the osteosarcoma cell line HOS were transfected with non-targeting (A), PTPMT1 siRNA#1 (B) or PTPMT1 siRNA#2 (C). After transfection of these siRNAs for 120 hours, the population of cells undergoing cell death and apoptosis was measured through propidium iodide positivity (y-axis) and Annexin V positivity (x-axis). (D) A panel of highly transfectable cell lines derived from many tissue types (see colored labels above heatmap) were transfected with non-targeting or PTPMT1 siRNAs. Cell death and apoptosis were assayed by propidium iodide and Annexin V positivity as in (A–C). Fold change in apoptosis was determined by normalizing percent cell death seen in cells transfected with a non-targeting control to 1, with fold change reflecting the amount of cell death above this threshold in PTPMT1 knockdown cells. The heatmap shows a range of fold change from 1 (black squares) to 5+ (five or greater fold, red squared).
