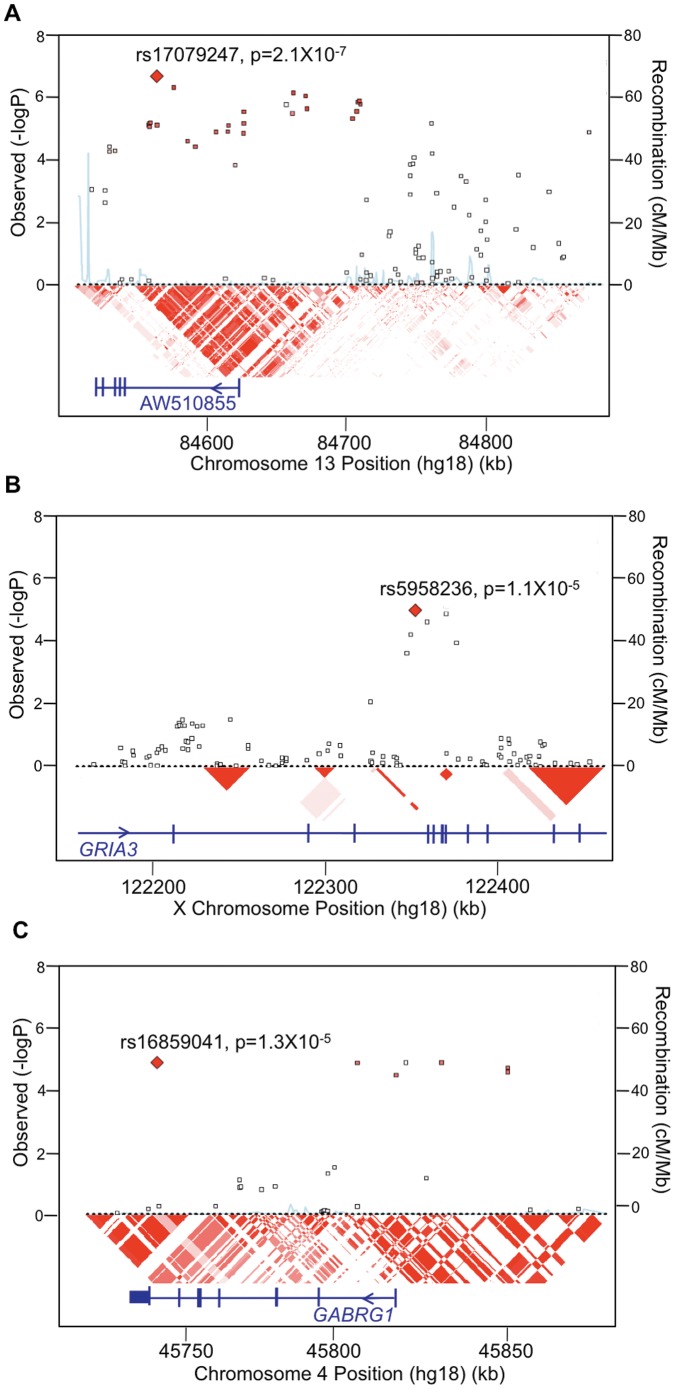
Figure 2. Details of the association results on chromosome 13 (A) and the X chromosome GRIA3 gene region (B) in the GAIN irritable vs. elated mania case-only analysis, as generated by SNAP 2.0.
The results for the chromosome 4 GABRG1 gene region in the GAIN irritable mania vs. control analysis are shown in (C). Physical position and gene annotations according to HapMap release 22 are shown along the x-axis, and −log (P value) is shown on the left y-axis. The most significant SNP is indicated as a large red diamond, and all other SNPs are colored according to linkage disequilibrium levels (r2) with the primary SNP, as calculated from HapMap Release 22 CEU population data, with darker red representing higher values. Recombination rate within the CEU samples is shown on the right y-axis in blue. RefSeq genes are shown with all possible exons and arrows indicating transcript direction.

