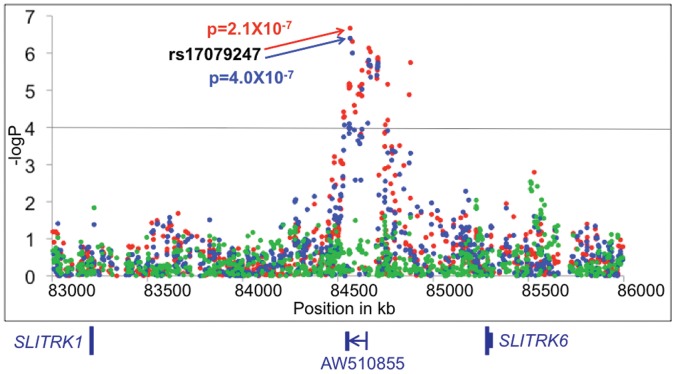
Figure 3. Results of the GAIN irritable vs. elated mania case-only analyses (red), the irritable mania vs. control analyses (blue), and the elated mania vs. control analyses (green) for the chromosome 13q31 region.
The physical position is shown along the x-axis with the –log of the p value for each SNP is shown along the y-axis. The locations of the SLITRK1 and SLITRK6 genes are indicated below, along with a spliced EST.

