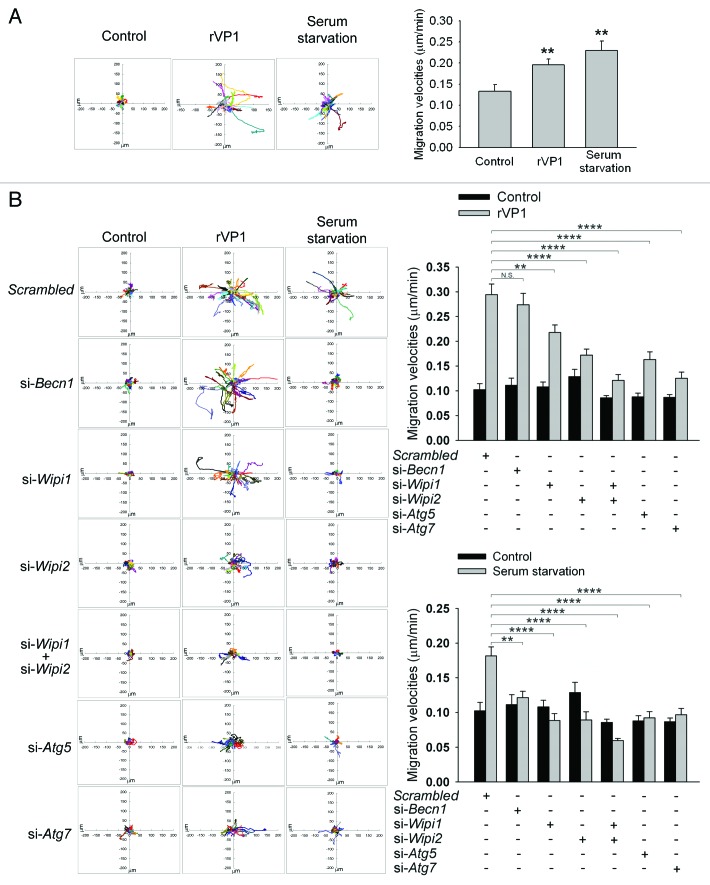
Figure 5. rVP1 regulated macrophage migration via BECN1-independent and WIPI1/WIPI2-dependent autophagy. Trajectories of cells in response to different treatments were measured by time-lapse microscopy as described in Materials and Methods and displayed in diagrams drawn with the initial point of each trajectory placed at the origin of the plot. (A) rVP1 and serum starvation induced macrophage migration. Time-lapse microscopy experiments were performed to obtain serial phase-contrast images every 15 min for 22 h. Trajectories (left panel) and migration velocity (right panel) of RAW264.7 cells treated with control medium, 4 μM rVP1 or serum starvation were displayed after 22 h of time-lapse. Data represent means ± SEM of migration velocities of 20 cells with different treatments; **p < 0.01. (B) Knockdown of WIPI1, WIPI2, ATG5 and ATG7 but not BECN1 attenuated rVP1-induced macrophage migration. RAW264.7 cells were transfected with siRNAs of scrambled, Becn1, Atg5, Atg7, Wipi1, Wipi2 and Wipi1 plus Wipi2 as indicated before treatment of 4 μM rVP1 or serum starvation. Trajectories and migration velocities of cells were displayed after 22 h of time-lapse. Data represent means ± SEM of migration velocity of 20 cells transfected with scrambled or target siRNA in response to rVP1 (top panel) or serum starvation (bottom panel); **p < 0.01, ****p < 0.0001, N.S., not significant.

An official website of the United States government
Here's how you know
Official websites use .gov
A
.gov website belongs to an official
government organization in the United States.
Secure .gov websites use HTTPS
A lock (
) or https:// means you've safely
connected to the .gov website. Share sensitive
information only on official, secure websites.
