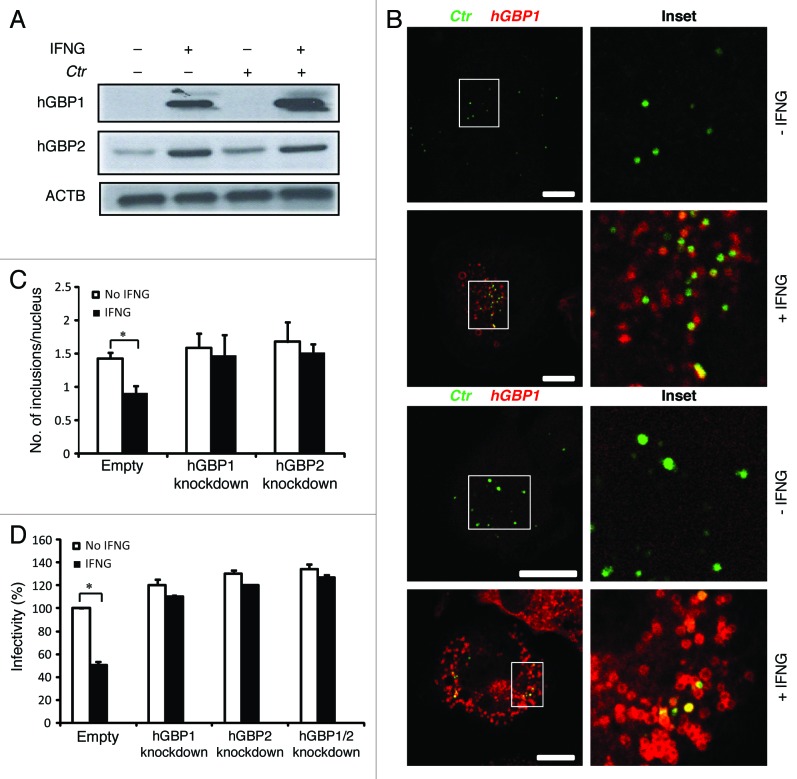
Figure 2. Early interactions of hGBP1 and GBP2 with chlamydial inclusions mediated IFNG-induced C. trachomatis growth inhibition. (A) Anti-hGBP1 and -GBP2 immunoblot analysis of total lysates from uninfected macrophages, and uninfected macrophages exposed to 100 U/ml IFNG for 24 h. Other monolayers were pretreated with IFNG for 24 h prior to infection and then infected in the presence of IFNG. Host ACTB was used as loading control. (A) hGBP1/2 expression is induced by IFNG, while infection alone had minimal stimulatory effect on hGBP2 expression. Only very low amounts of cellular hGBP2 can be detected in control cells, compared with treated cells. Blot is representative of two independent experiments (B) Double immunofluorescence labeling of hGBP1, hGBP2 and C. trachomatis in macrophages stimulated for 24 h with 100 U/ml IFNG and then infected for 2 h with C. trachomatis (MOI 50). IFNG untreated cells were similarly infected. Upon IFNG induction hGBP1/2 localized to inclusions. For quantification, approximately 100 cells were examined for hGBP1/2-C. trachomatis colocalization in cytokine-treated or untreated cells. Colocalization calculated as a mean percentage: for each treatment, number of hGBP1/2 positive inclusions/total number of inclusions × 100 from two independent experiments (C and D) Deletion of either hGBP1, hGBP2 or both promotes intracellular growth of the bacterial inclusion. Unstimulated and IFNG-stimulated THP1-derived macrophages were infected with C. trachomatis for 48 h (MOI 5). IFNG stimulation did not inhibit chlamydial growth in hGBP1, hGBP2 or double knockdown deficient cells compared with THP1- and control (empty)-derived macrophages. (C) Analysis of inclusion numbers in cells infected (MOI 5) for 48 h was performed by counting inclusions in 100 cells. (D) Infectivity of bacteria in hGBP1 or hGBP2 deficient cells, as well as double knockdown cells is 2-fold higher than in control (empty)- or THP1-derived macrophages. Results depicted as mean percentage normalized to control. Results shown in (C and D) are from three independent experiments. Error bars ± SD. Statistical significance was analyzed by Student’s t-test; *p < 0.01. Scale bars: 10 μm.

An official website of the United States government
Here's how you know
Official websites use .gov
A
.gov website belongs to an official
government organization in the United States.
Secure .gov websites use HTTPS
A lock (
) or https:// means you've safely
connected to the .gov website. Share sensitive
information only on official, secure websites.
