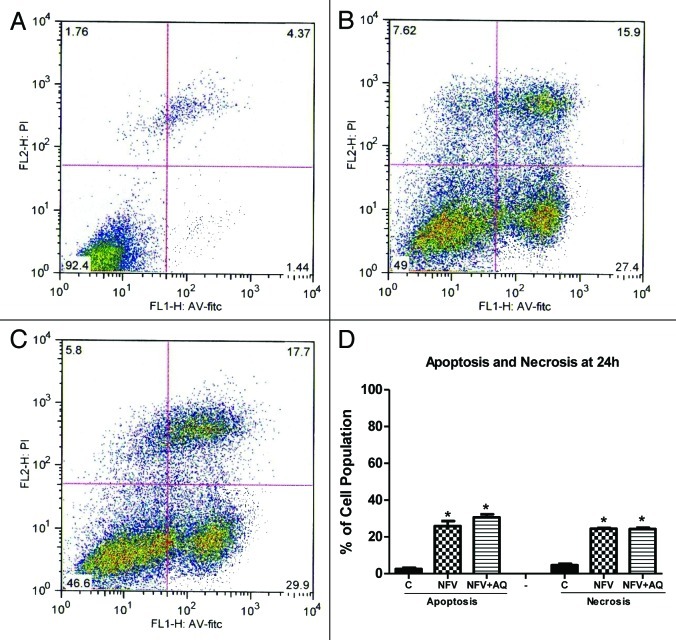
Figure 3. Flow cytometry analysis for apoptosis and necrosis rates on intestinal epithelial IEC-6 cell apoptosis and necrosis following 24 h of NFV treatment at 70 μg/mL, with or without supplementation with 10 mM of alanylglutamine (AQ). Control group (A), NFV (B), NFV+AQ (C). Lower-right quadrant represent apoptotic cells (high annexin V-FITC and low propidium iodide staining), lower-left quadrant indicate viable cells (low annexin V-FITC and propidium iodide staining), and upper-right quadrant show necrotic cells (high propidium iodide and annexin V-FITC staining). Graph (D) indicates the effect of both 1 h and 24 h exposure to NFV at 70 μg/mL and supplementation with AQ at 10 mM.

An official website of the United States government
Here's how you know
Official websites use .gov
A
.gov website belongs to an official
government organization in the United States.
Secure .gov websites use HTTPS
A lock (
) or https:// means you've safely
connected to the .gov website. Share sensitive
information only on official, secure websites.
