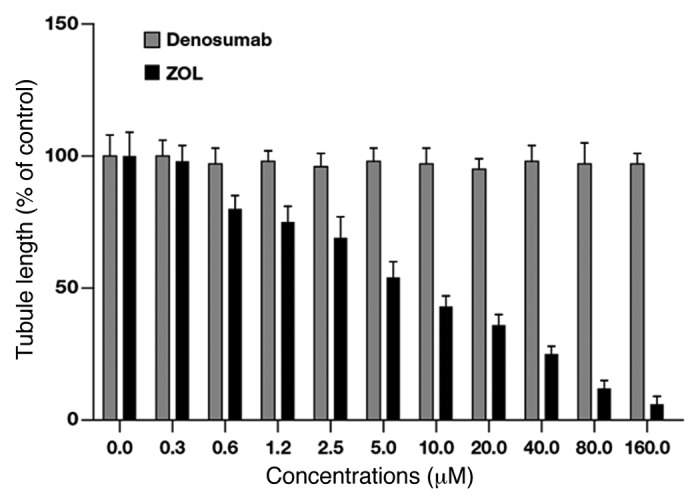
Figure 6. Quantification of the effects of Dmab and ZOL on HUVEC tubule formation. Capillary-like networks were quantified with ImageJ software. Each point is the mean of at least four different replicate experiments (± S.D.). Statistical analysis: p < 0.05, untreated vs. 0.6 μM, 1.2 μM and 2.5 μM ZOL treated cells; p < 0.01, untreated vs. 5.0 μM, 10.0 μM and 20.0 μM ZOL treated cells; p < 0.001, untreated vs. 40.0 μM, 80.0 μM and 160.0 μM ZOL treated cells.
