
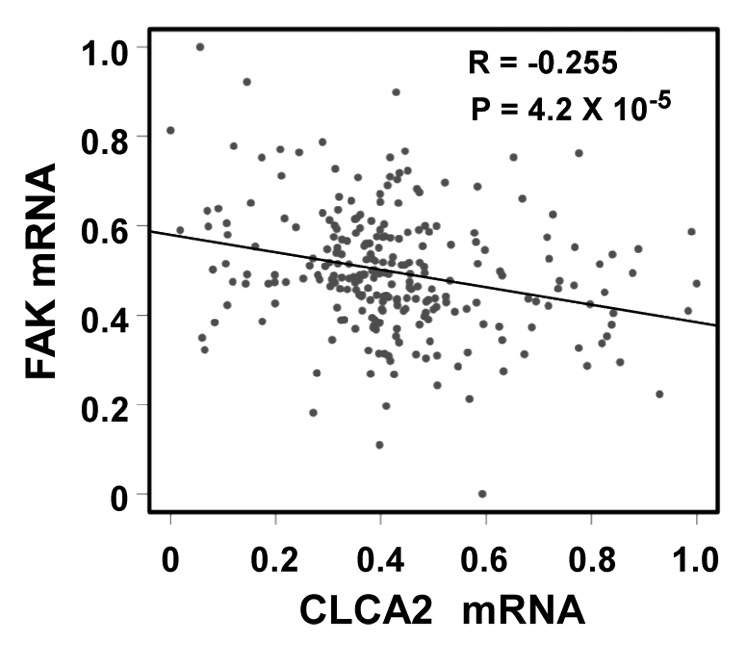
Figure 7. A negative correlation between CLCA2 and FAK expression in human breast cancer tissues. An expression microarray experiment conducted by Miller, et al.37 and available at the GEO database (data set GSE3494) was queried for levels of CLCA2 and FAK. Normalized mRNA signals (lowest = 0, highest = 1) from 251 breast cancer samples were plotted. The Pearson correlation coefficient is shown.