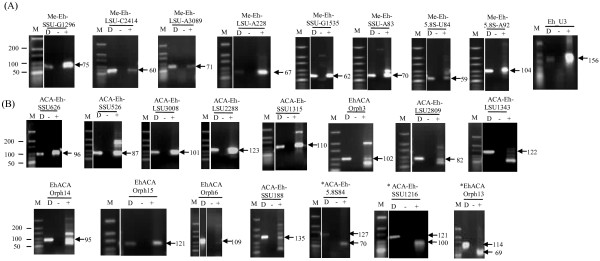
Figure 2.
Expression analysis of E. histolytica snoRNAs by Reverse-Transcription PCR (RT-PCR). 5 μg of total RNA was reverse transcribed followed by PCR with primer pairs specific to each snoRNA. RT-PCR of computationally predicted C/D box snoRNAs (A) and H/ACA box snoRNAs (B). Arrows indicate the amplicon obtained by RT-PCR. The snoRNAs which have deviated from the predicted size are marked by asterisk. Lane D is the positive control, containing genomic DNA as template. + and – are the RT-PCR reactions with and without reverse transcriptase respectively. Lane M, Size markers 10–300 bp ladder (Fermentas).

