Figure 8.

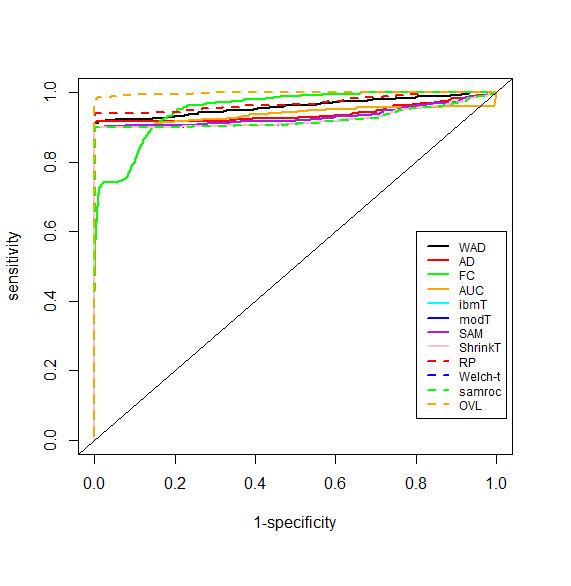
Empirical ROC curves. Comparison of ROC curves in experiments where the goal is to select up- and down-regulated genes and special genes.

Empirical ROC curves. Comparison of ROC curves in experiments where the goal is to select up- and down-regulated genes and special genes.