Figure 2.

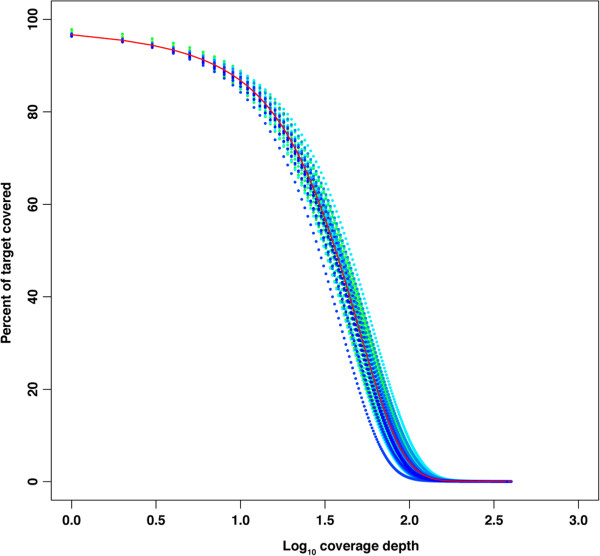
Cumulative distribution of coverage depth in bait regions. Both mean coverage across all 48 genotypes (red line) and mean coverage for individual genotypes (colored points) are provided.

Cumulative distribution of coverage depth in bait regions. Both mean coverage across all 48 genotypes (red line) and mean coverage for individual genotypes (colored points) are provided.