Figure 5.

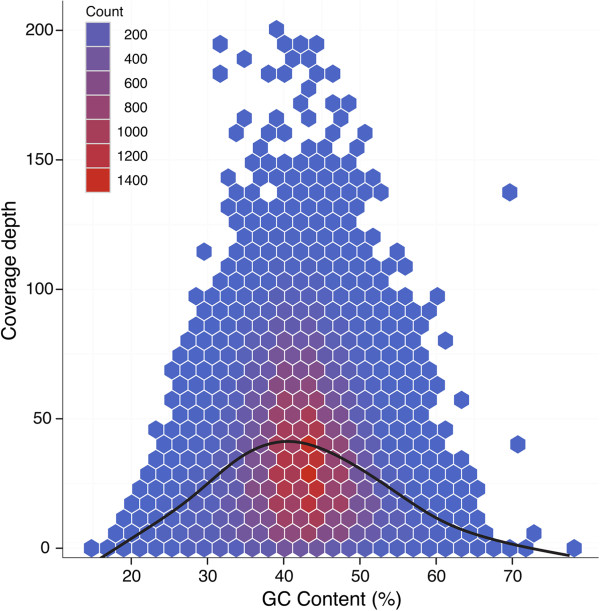
Hexbin scatterplot and loess fit (black line) of the relationship between mean GC content of a target region and coverage depth. Colors reflect the density of data points.

Hexbin scatterplot and loess fit (black line) of the relationship between mean GC content of a target region and coverage depth. Colors reflect the density of data points.