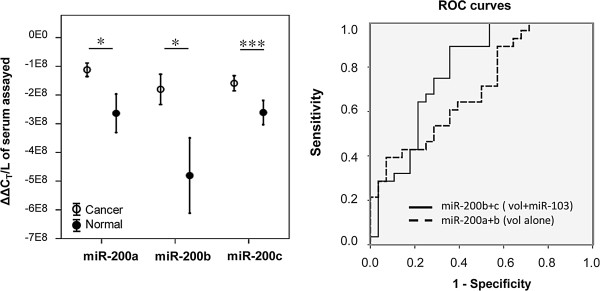
Figure 4.
miR-200a, b and c are significantly elevated and predictors of ovarian cancer in patient serum. [A] Mean expression of miR-182, miR-200a, miR-200b and miR-200c in cancer and normal serum; volume adjusted values normalized to miR-103 (ΔΔCT/L-1 of serum assayed) +/- SEM (N = 56). *P < 0.05, ***P < 0.0005, Mann–Whitney U Test [B] ROC curves for miRNA combinations with the highest AUC for volume adjusted results (vol alone; AUC = 0.705) and volume adjusted results normalized to miR-103 (vol + miR-103; AUC = 0.784).

