Figure 6.

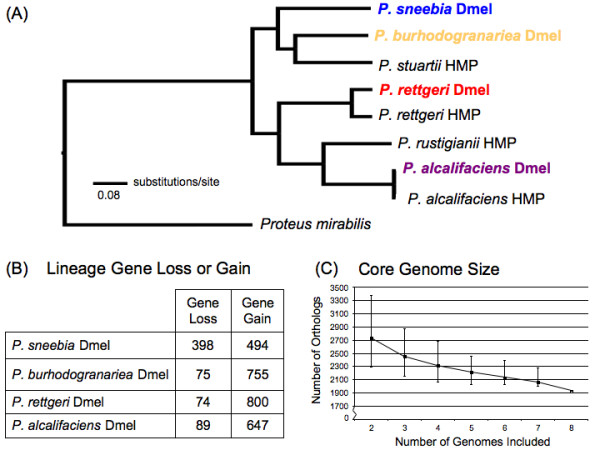
(A) Phylogenetic relationships of eight sequenced Providencia strains and the outgroup Proteus mirabilis. This phylogeny is constructed from a concatenation of 1651 orthologous genes shared by all nine genomes and was inferred using maximum likelihood methods within the program RAxML [32]. The Providencia isolated from D. melanogaster are shown in bold and color. The scale bar indicates number of substitutions per site. Each node of the tree is supported by a bootstrap value of 100. (B) Gene losses and gains along lineages leading to Providencia isolated from D. melanogaster. Numbers indicate the number of inferred gene gains and losses on each lineage for the four strains isolated from D. melanogaster. These numbers highlight that P. sneebia has experienced a much greater gene loss than the other species. (C) Core genome size when different numbers of genomes are included. The point indicates the average number of orthologs in each comparison while the error bars indicate the highest and lowest number of orthologs for all possible combinations of each number of genomes.
