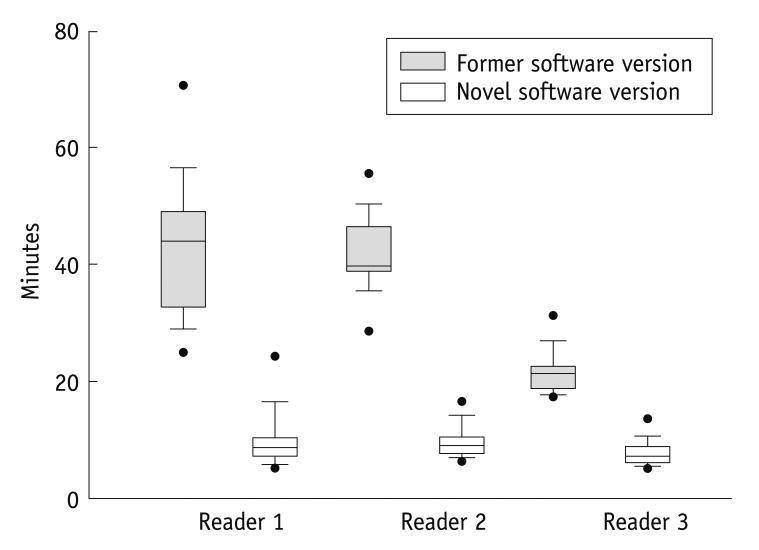
Fig. 1.
Overall reading time. For novel software, overall reading time was significantly reduced (white boxplots) compared to former version (grey boxplots, p = <0.001 for all readers). Median (horizontal bar within boxplot) analysis time of Reader 1 and Reader 2 was equivalent, however Reader 3 with more experience had significantly less reading time in both novel and former software version compared to Readers 1 and 2. Black dots represent 5th/95th percentile.

