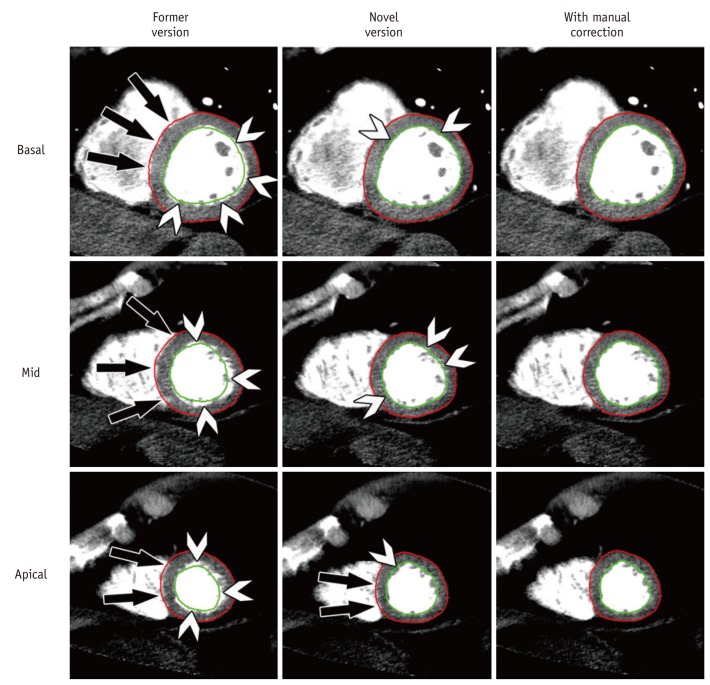
Fig. 2.
Myocardial contour detection. Effects of improved automated contour detection by novel software version are shown in column 2 where precise epicardial (red) and endocardial (green) delineation is present. Only few endocardial regions need manual correction (arrowheads) and especially epicardium had to be manually corrected only in septal area of apical third of heart (bottom row, image in middle with arrows). In contrast, detection was poor (column 1) in former software version and required extensive, almost circumferential contour corrections (arrows and arrowheads) in total of 18 slices. Results after manual correction are represented in column 3 showing congruent delineation of epi- and endocardial borders with exclusion of papillary muscles and trabecular structures. All images (wl 100/ww 200) are taken from rest CTP, slice thickness is 8 mm.

