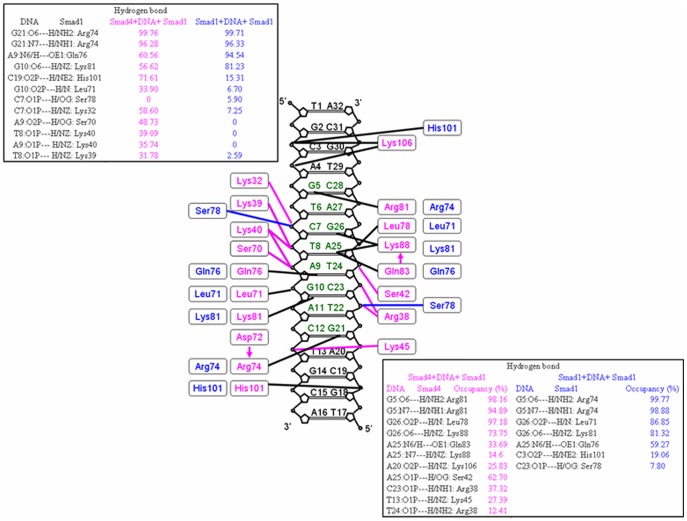
Figure 3. The hydrogen bonds at Smad1-DNA and Smad4-DNA interfaces.
The occupancies of hydrogen bonds at Smad1-DNA interfaces in Smad4+DNA+Smad1 (magenta) and Smad1+DNA+Smad1 (blue) models on the left, respectively; and the occupancies of hydrogen bonds at Smad4-DNA interface in the Smad4+DNA+Smad1 model (magenta) and at Smad1-DNA interface in the Smad1+DNA+Smad1 model (blue) on the right, respectively.

