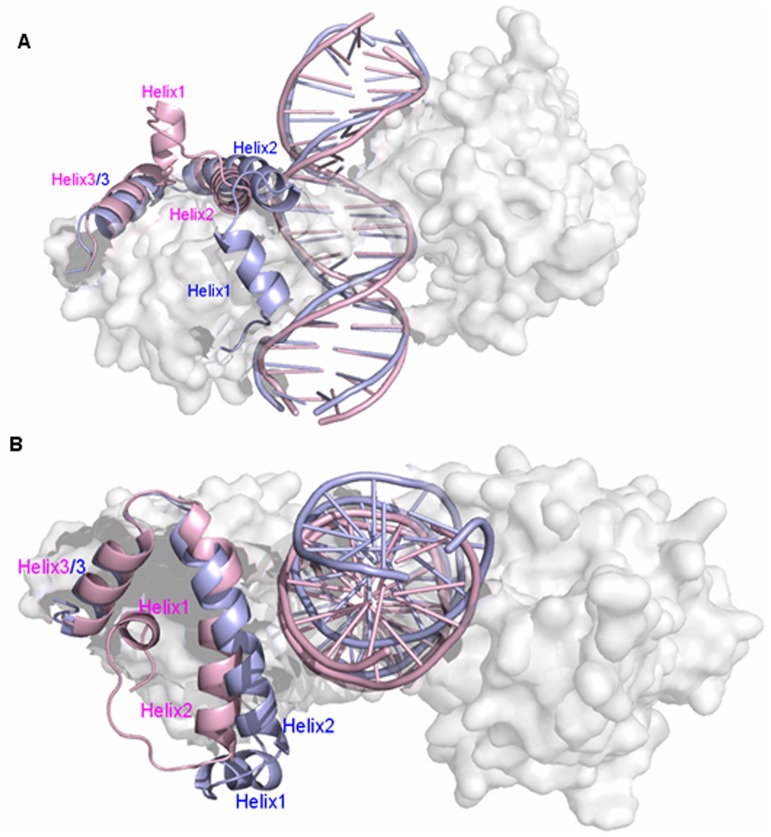
Figure 4. The superpositions of average structures for Smad4+DNA+Smad1 and Smad1+DNA+Smad1 models.
The visual superpositions for average structures of Smad4+DNA+Smad1 (light blue) and Smad1+DNA+Smad1 (light pink) models as viewed orthogonal (A) and parallel (B) to DNA axis. Selected helices shown in cartoon form with the remaining part colored in white semi-transparent surface.

