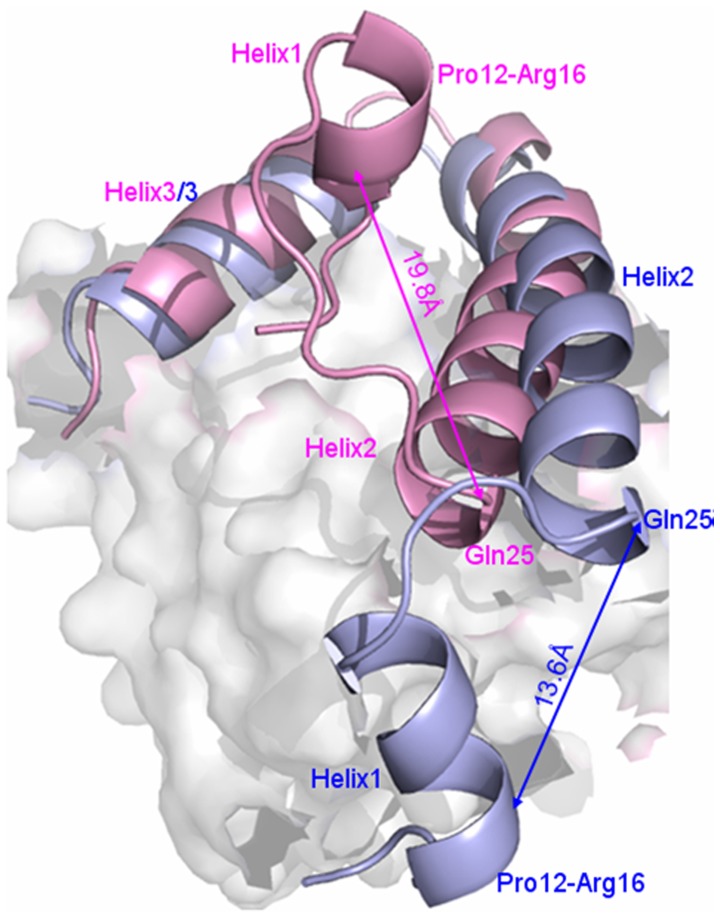
Figure 6. Scheme of conformational changes for helix1 of Smad1 in Smad4+DNA+Smad1 and Smad1+DNA+Smad1 models.
Scheme of conformational changes for helix1 of Smad1 in both Smad4+DNA+Smad1 (light pink) and Smad1+DNA+Smad1 (light blue) models with the distances between Pro12-Arg16 residues of helix1 and Gln25 residue of helix2.

