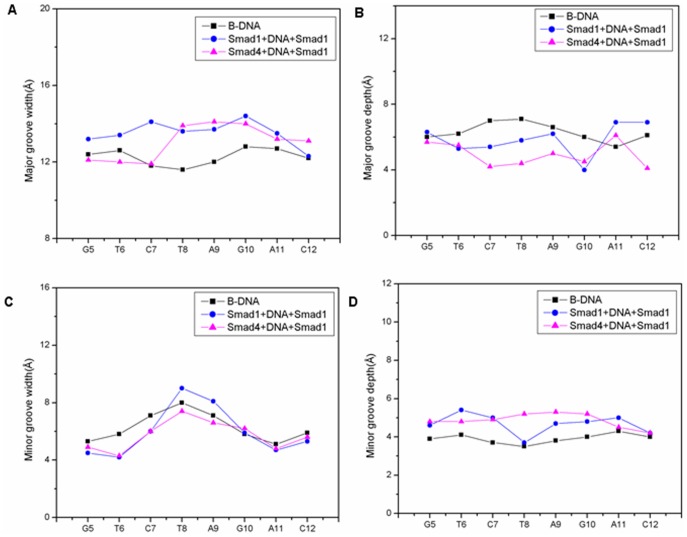
Figure 10. Groove widths and depths of B-DNA, Smad4+DNA+Smad1 and Smad1+DNA+Smad1 models.
Groove widths and depths of B-DNA (black line with square), Smad4+DNA+Smad1 (magenta line with up-triangle) and Smad1+DNA+Smad1 (blue line with circle) models. Major groove widths (A), major groove depths (B), minor groove widths (C) and minor groove depths (D) for the time-averaged structures of DNA conformations.

