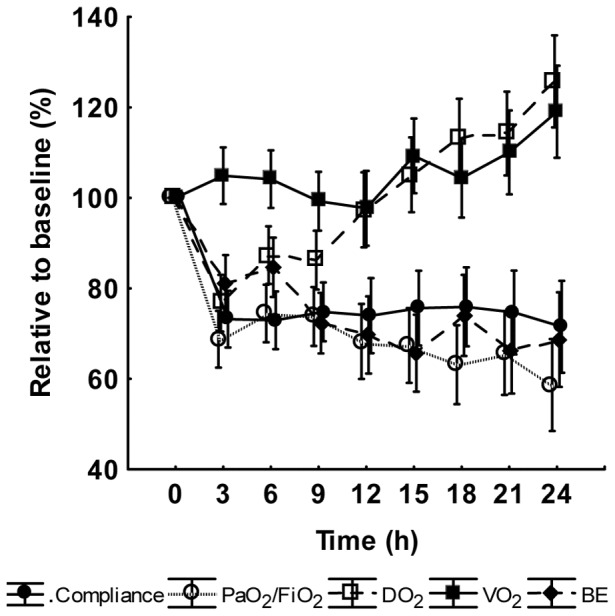
Figure 5. The development during the experiment of compliance, PaO2/FiO2, oxygen delivery (DO2), oxygen consumption (VO2) and base excess (BE).

Values are given as relative to the baseline value in percent. Mean ± SE, (n = 18). Baseline values: Compliance 25±1 mL×cm H20−1, PaO2/FiO2 426±16 mmHg, DO2 454±36 mL×min−1, VO2 134±8 mL×min−1 and BE 7±0.5 mmol×L−1.
