
Figure 1. mRNA expression levels of genes involved in cholesterol metabolism after TSA treatment.
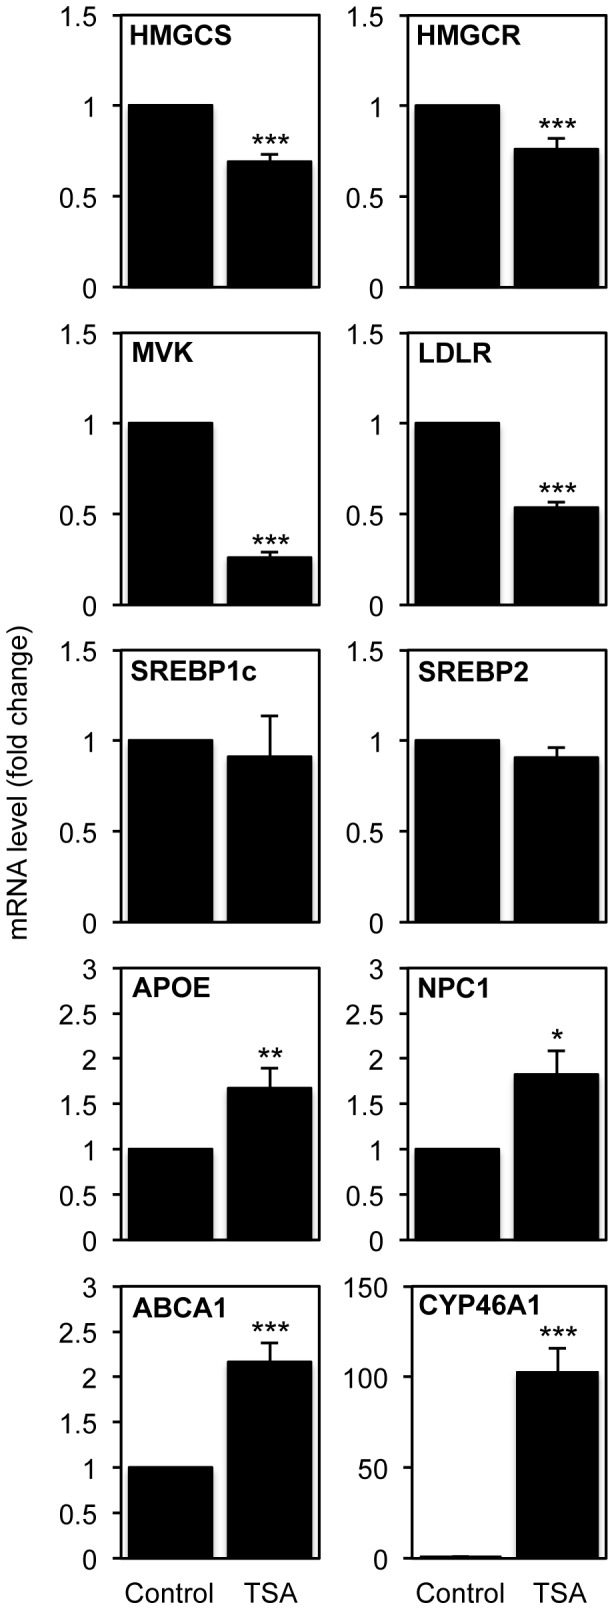
SH-SY5Y neuroblastoma cells were treated with 250 nM TSA for 16 h. mRNA transcript levels of HMGCS, HMGCR, MVK, LDLR, SREBP1c and 2, APOE, NPC1, ABCA1 and CYP46A1 were analyzed by real-time RT-PCR. Values were normalized to the internal standard β-actin and expressed as fold change relative to untreated cells. Values represent means ± SEM from at least three individual experiments (* p<0.05, ** p<0.01, *** p<0.001).