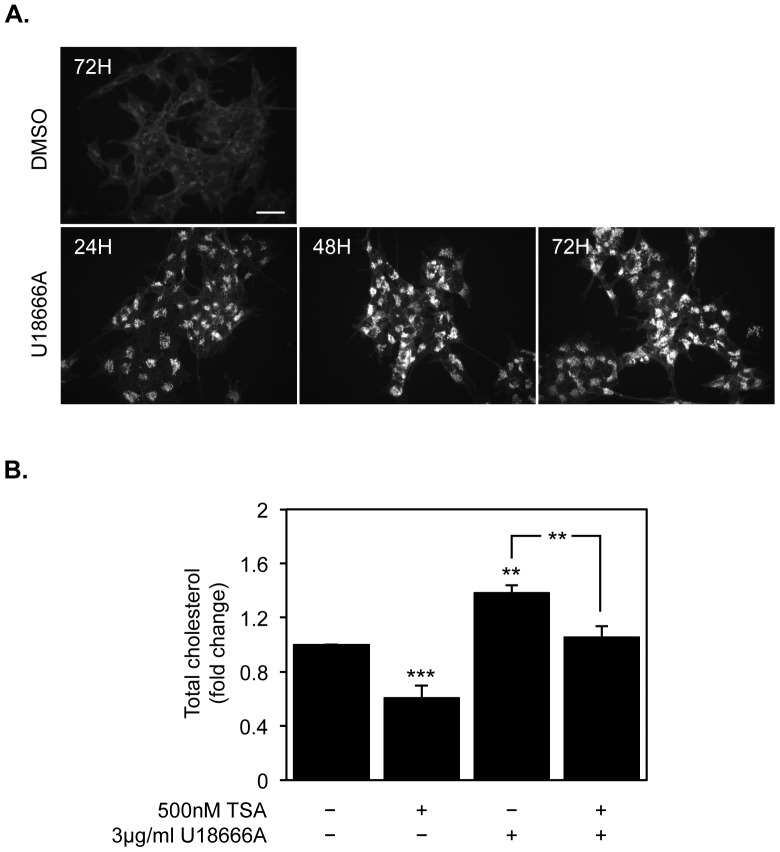
Figure 5. TSA reverts the increase in total cholesterol levels observed after U18666A treatment.
A) Filipin III immunofluorescence staining of SH-SY5Y cells treated for the indicated time-points with 1 µg/ml U18666A or vehicle (scale bar = 40 µm). B) SH-SY5Y cells were treated with 3 µg/ml U18666A for 24 h and with or without 250 nM TSA for 48 h, and total cholesterol levels were determined. Values were normalized to total protein content and expressed as ng of cholesterol per µg of total protein. Data represent means ± SEM from at least three individual experiments (** p<0.01, *** p<0.001).

