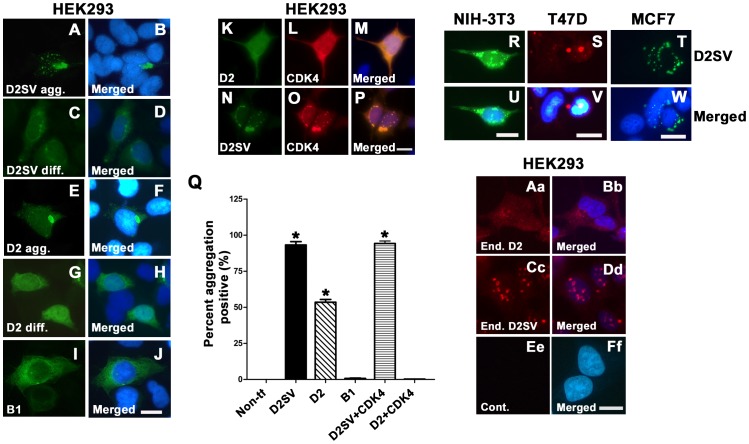
Figure 1. Characterization of cycD2SV aggregation in immortalized cell lines.
HEK293 cells transfected with cycD2SVmyc (A–D), cycD2myc (E–H) and cycB1 (I, J) processed for myc (A, C, E, G) and cycB1 (I) immunostaining and nuclear stain (B, D, F, H, J). HEK293 cells co-transfected with cycD2myc and CDK4 (K–M) and cycD2SVmyc and CDK4 (N–P) processed for cycD2SV (K), cycD2 (N) and CDK4 (L, O). NIH-3T3 (R, U), T47D (S, V) and MCF7 (T, W) cells transfected with cycD2SVmyc and processed for myc (R, S, T) immunostaining and nuclear stain (U, V, W). The percentage of HEK293 cells positive for protein aggregation was determined for cycD2SVmyc, cycD2myc, cycB1, cycD2SV plus CDK4 and cycD2 plus CDK4 transfected cells (Q). Cells positive for protein aggregates were quantified and expressed as a percent of total counted cells (Q). Non-transfected (Non-tf) cells stained with myc antibodies were used as a control for protein aggregation. Values are expressed as mean ± SEM. One way ANOVA, *p<0.05 compared to non-transfected control, approximately 1000 cells were counted for each group from three independent experiments (N = 3). Endogenous cycD2 (Aa, Bb) and cycD2SV (Cc, Dd) expression was analyzed in untransfected HEK283 cells. Cells were processed for cycD2 (Aa) and cycD2SV (Cc) immunostaining and nuclear stain (Bb, Dd, and Ff). Primary antibody was omitted as a control (Ee, Ff). Scale bar is 20 µm (A–J; K–P; R, U; S, V; T, W; Aa–Ff).

