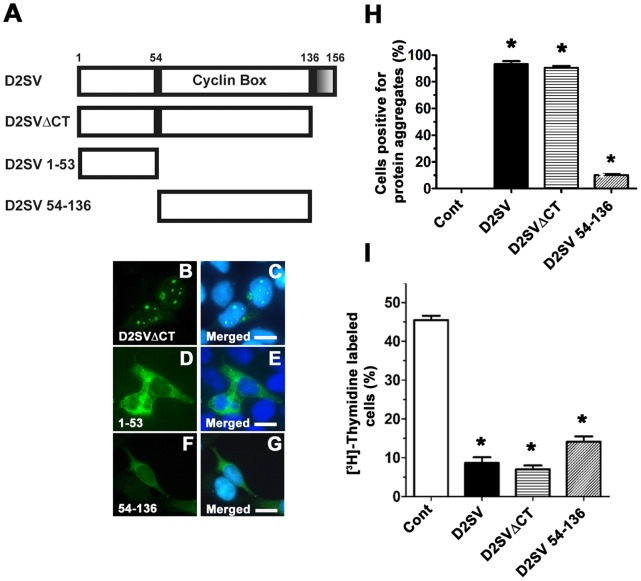
Figure 3. Effects of cycD2SV 54–136 and cycD2SVΔCT overexpression on cell cycle regulation.
A schematic representation of D2SVΔCT, D2SV 1–53 and D2SV 54–136 deletions in comparison to full length D2SV (A). Shaded box (136–156 amino acids) in cycD2SV represents the unique CT sequence. HEK293 cells transfected with D2SVΔCTmyc (B, C), D2SV 1–53 (D, E) and D2SV 54–136 myc (F, G) were processed for myc (B, D, F) immunostaining and nuclear stain (C, E, G). Scale bar is 20 µm. HEK293 cells transfected with D2SV, D2SVΔCT and D2SV 54–136 were labeled with [3H]-thymidine and processed for immunostaining and [3H]-thymidine autoradiography. The percentage of cells positive for protein aggregation (H) and [3H]-thymidine (I) were quantified and expressed as a percent of total transfected cells. Cells transfected with pcDNA 3.1 vector were used as a control (cont). Values are expressed as mean ± SEM. One way ANOVA, *p<0.05 compared to control, approximately 1000 cells were counted for each group from three independent experiments (N = 3).

