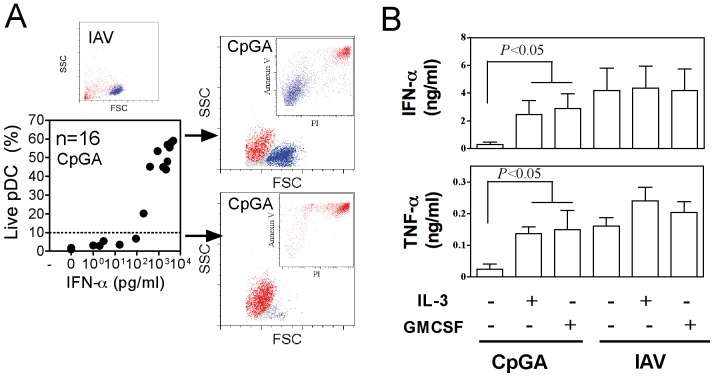
Figure 3. Survival fate of neonatal pDC following CpG activation.
(A) IFN-α responses of neonatal pDCs to CpGA were plotted against the survival rate. Cell survival is shown by annexin V and propidium iodide staining (PI). (B) Neonatal pDCs were stimulated with CpGA or IAV in the absence or presence of IL-3 (10 ng/ml) or GMCSF (10 ng/ml) for 24 hrs. IFN-α was detected from supernatants.

