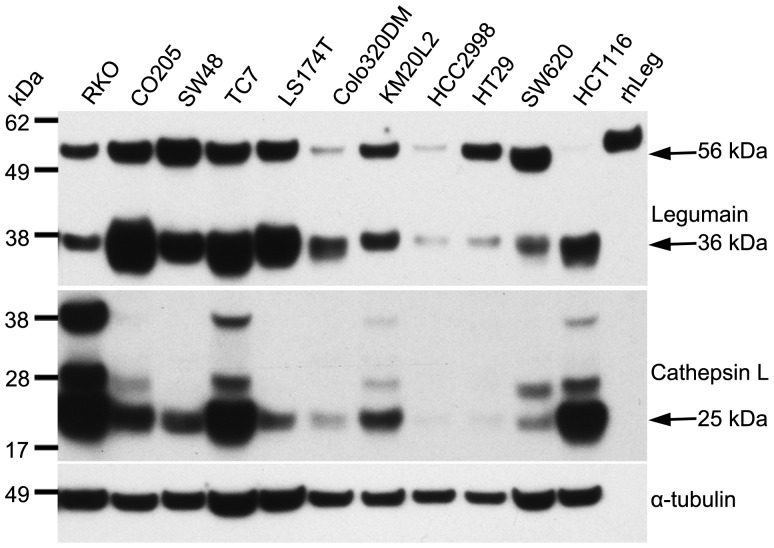
Figure 1. Expression of legumain and cathepsin L in CRC cell lines.
Immunoblots of cell lysates from a panel of CRC cell lines demonstrated high variability in the total amount of legumain and cathepsin L, and also in the presence of the different mature forms. HCT116 and SW620 cells were particularly interesting as they show mutually exclusive high amount of the active (36 kDa) and inactive pro-form (56 kDa) of legumain, respectively. Uncut immunoblots (Fig. S2A).

