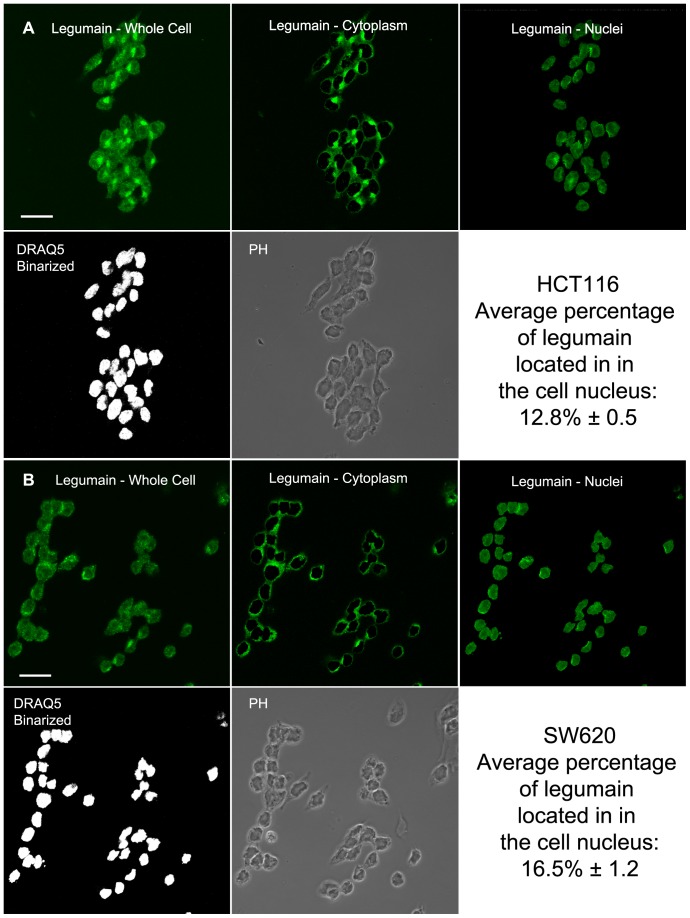
Figure 5. Percentage of expressed legumain located in the nucleus.
(A and B) Representative pictures of HCT116 (A) and SW620 (B) cells by one optical slice from one of five independent z-stacks each containing 30–40 immunofluorescently labeled cells using legumain-specific antibodies (green), with DRAQ5™ counter-stained nuclei (binarized; white). By means of a semi-automated procedure in Image J the captures of nuclei (binarized) was used as a mask to separate the nuclear (top right) from the cytoplasmic (top middle) signal components of the total (top left) signal representing expression of legumain. The total signal from legumain fluorescence in each optical slice was summarized from all five z-stacks enabling for the estimation of the expressed amount of legumain in the nuclear compartment. Statistical errors in the calculations are reported as standard error of the mean of the five independent z-stacks. Scale bar represents 20 µm.

