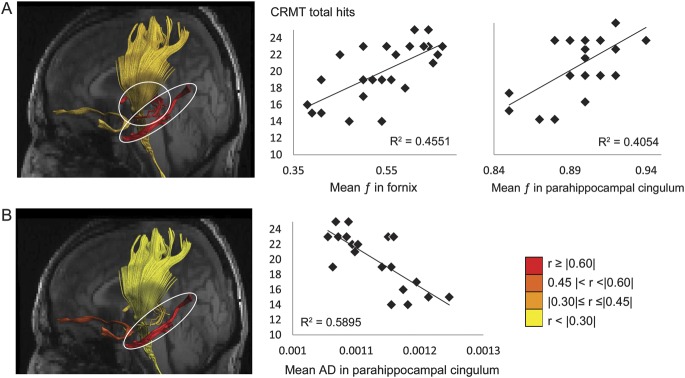
Figure 1. Reconstructions of the fornix, uncinate fasciculus, parahippocampal cingulum, and corticospinal tract in the native space of one individual with mild cognitive impairment coregistered with that individual's T1-weighted structural MRI showing the left side of the brain.
The tracts are color-coded to visualize the strength of the correlations between (A) tissue volume fraction f and (B) axial diffusivity (AD) and face recognition performance in the Camden Recognition Memory Test (CRMT) for the patient group. The correlations between recognition performance and volume fraction in the fornix, volume fraction in the parahippocampal cingulum, and AD in the parahippocampal cingulum reached false discovery rate–corrected significance level with q < 0.01 and are highlighted by white ovals and illustrated further in the scatter plots.

