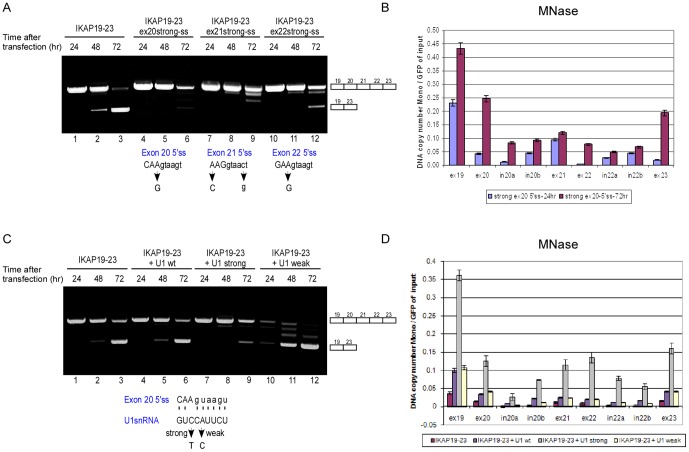
Figure 2. Alternative splicing affects nucleosome occupancy.
(A) IKAP19–23 minigenes with different mutations that strengthened the 5′ss of each internal exon were transfected into 293 cells and splicing was evaluated. “Strong-ss” indicates a mutation that strengthened the splice site score [1]. The positions of the 5′ss mutations for each minigene are indicated with an arrow in the lower part of the panel. (B) The IKAP19–23 minigene with a strong exon 20 5′ss was transfected into 293 cells, and nuclei were extracted 24 and 72 hr following transfection. Half of each sample was treated with MNase and half was untreated. Mononucleosomal DNA was extracted from an agarose gel and subjected to absolute QPCR analysis with primers that cover most of the minigene. Data are presented as DNA copy number and were normalized to transfection efficiency using primers for the GFP area of the plasmid using untreated samples. (C) Co-transfection of the IKAP19–23 minigene into 293 cells was performed with plasmids that express U1 snRNAs. Three different U1 snRNA plasmids were used (as shown in the lower part of the panel): wt U1, U1 with a mutation that strengthens its base pairing with exon 20 5′ss (U1 strong), and U1 with a mutation that weakens the base pairing with exon 20 5′ss (U1 weak). Watson-Crick base pairing is marked by dashed line. The position of the relevant mutation in U1 snRNA is indicated with an arrow. RNA samples were extracted 24, 48, or 72 hr following transfection. The splicing products were separated on a 2% agarose gel after RT-PCR. The PCR products were eluted and sequenced. (D) The IKAP19–23 minigene was co-transfected into 293 cells with either U1 wt, U1 strong or U1 weak plasmid. 72 hr after the transfection, nucleosome occupancy was determined using an MNase assay as above. All experiments were repeated independently three times, and the results shown are representative of an average experiment. QPCR experiments were performed in triplicate; results shown are mean values ± SD.

