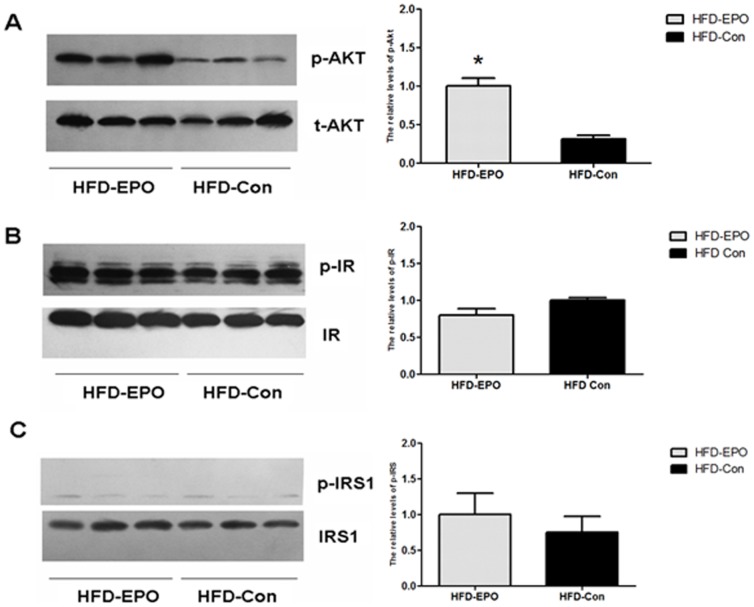
Figure 3. The effect of EPO on the levels of insulin signaling events in the liver.
The levels of total Akt, IR and IRS1 and phosphorylated Akt, IR and IRS1 in the livers of individual mice were determined by Western blot assays and the relative levels of Akt, IR and IRS1 phosphorylation were analyzed by densimetric analysis using ImageJ software. Data shown are representative images and expressed as the mean ± SEM of individual groups (n = 6 per group) of mice from three separate experiments. (A) Western blot and quantitative analyses of the levels of Akt activation. (B) Western blot and quantitative analyses of the levels of IR activation. (C) Western blot and quantitative analyses of the levels of IRS1 activation. *P<0.05 vs. the HFD-Con group.

