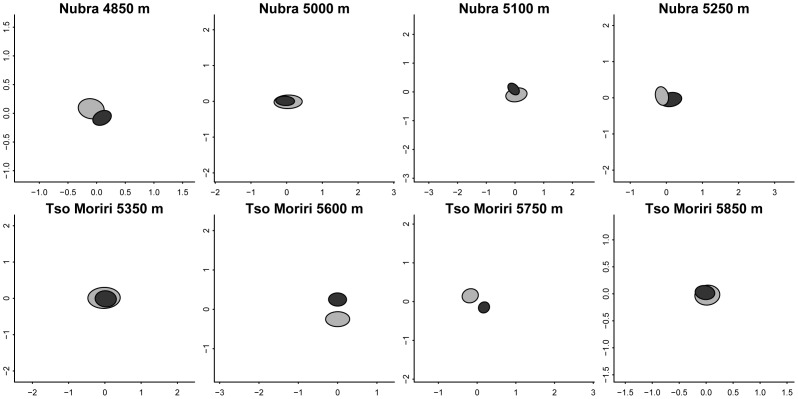
Figure 6. Differences in species composition of vascular plants between the cushions (black) and open areas outside cushions.
Diagrams are from non-metric multidimesional scaling (NMDS). Each diagram shows 95% confidence ellipses around multivariate centroid of samples from cushions (black) and open areas outside cushions (grey). Differences are statistically significant (p<0.01) at all elevations (detailed results from PERMANOVA are given in Table S2).

