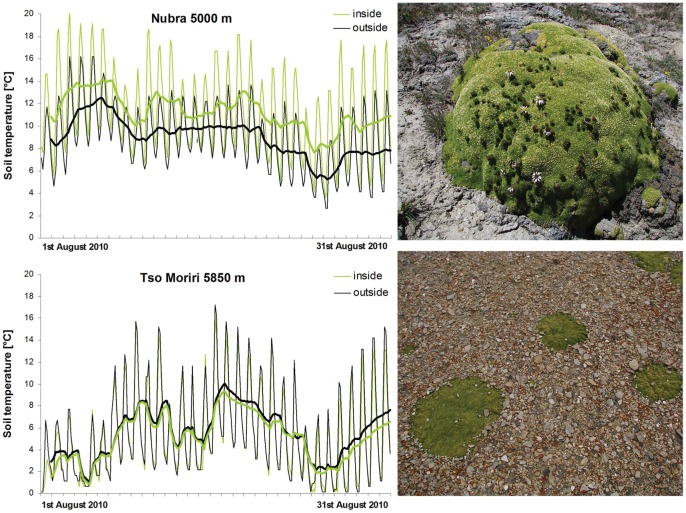
Figure 8. Soil temperature regime.
Sampled inside the T. caespitosum cushion and in the soil of the adjacent open area at Nubra 5000 m and Tso Moriri 5850 m. Thick lines depict the moving average for eight daily measurements. Photos on the right side of the panel show the variability in the growth of cushions; generally, individuals from lower elevations are gibbous and protruding above the ground, individuals from the upper part of the distributional gradient are flat.

