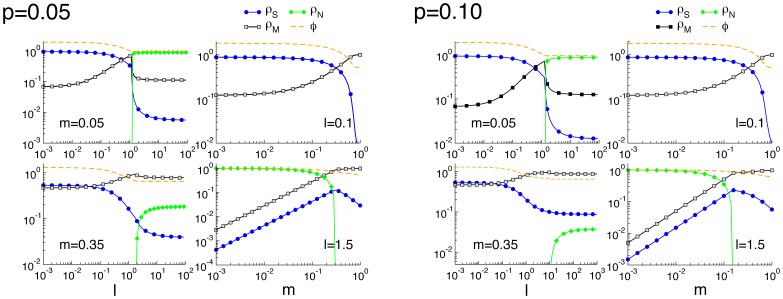
Figure 2. Species densities at the steady state for small .
 . Densities of
  (blue),
  (green) and
  (gray) genomes as a function of the environmental mutation rate
  for fixed
  , and as a function of
  for fixed
  . The left panel corresponds to
  , and the right panel to
  . Dashed orange lines represent the average fitness of the population.

