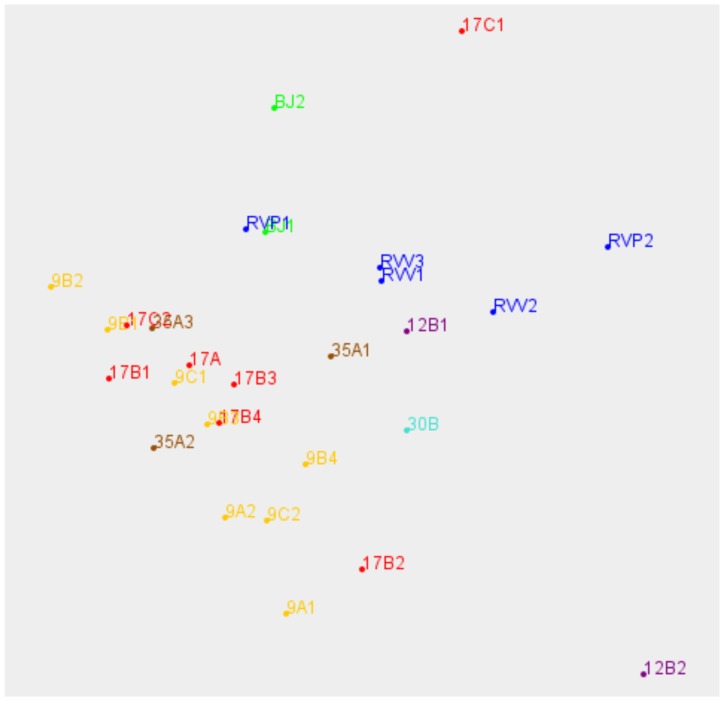
Figure 5. Cluster analysis of M. tuberculosis complex strains using Biolog PM data.
. Each replicate inoculum is displayed with its coordinates in the 3 major dimensions, rotated to display groupings. Coding, including colour, is explained in the list of strains used in this study (Table 1).

