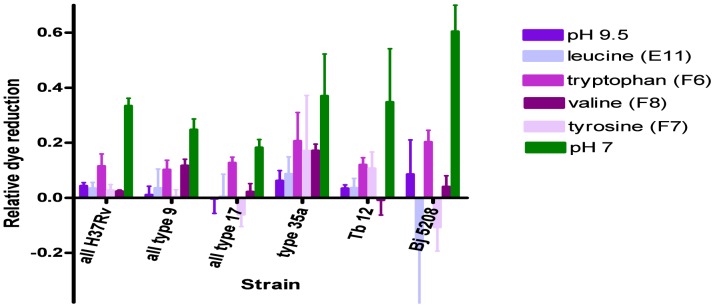
Figure 9. Effect of amines at pH 9.5 on relative dye reduction in M. tuberculosis complex strains.
Mean ± SEM relative dye reduction values for 2 to 4 experiments are shown for each strain for a range of amines. The bars in green show relative dye reduction values at pH 7 to enable interpretation of the degree of restoration of dye reduction in wells in PM10 plates with the amines at pH 9.5. The basal dye reduction, in wells at pH 9.5 with no addition, is shown in violet.

