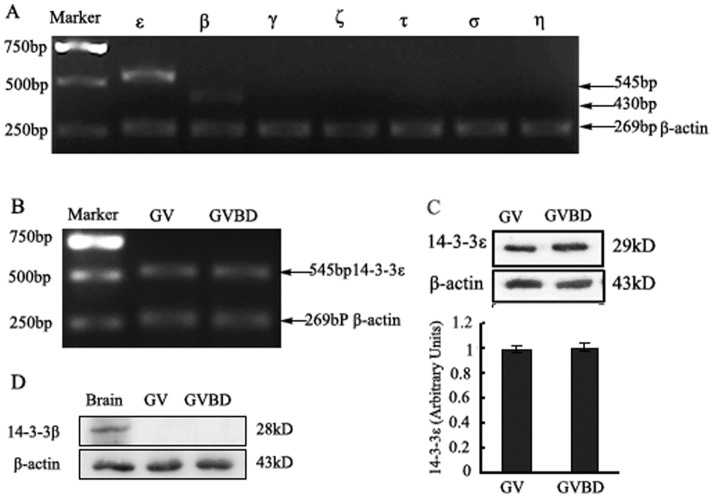
Figure 1. Identification of 14-3-3 isoforms expressed in GV and GVBD mouse oocytes.
(A) the mRNA levels of 14-3-3 isoforms at GV stage of mouse oocytes. mRNA of 120 mouse oocytes of GV stage were extracted (described in the“Materials and Methods” Section). RT-PCR products using primers for specific 14-3-3 isoforms are observed in ethidium bromide-stained agarose gel. ε, β, γ, η, σ, τ and ζ represent seven 14-3-3 isoforms. (B) the mRNA levels of 14-3-3ε at GV and GVBD stage of mouse oocytes. Line GV: mouse oocytes at GV stage. Line GVBD: mouse oocytes at GVBD stage. (C) A protein band of approximately 28 kDa from 200 mouse oocytes at GV or GVBD stage is detectable by Western blot with an anti-14-3-3ε antibody (upper panel). In contrast an anti-β-actin antibody detected a low molecular weight band of approximately 43 kDa (lower panel). (D) Western blot analysis 14-3-3β protein expression with an anti-14-3-3β antibody from 300 mouse oocytes at GV or GVBD stage, A protein band of approximately 29 kDa (upper panel). Line Brain: mouse brain protein as positive control. Shown is a representative of three independent experiments.

