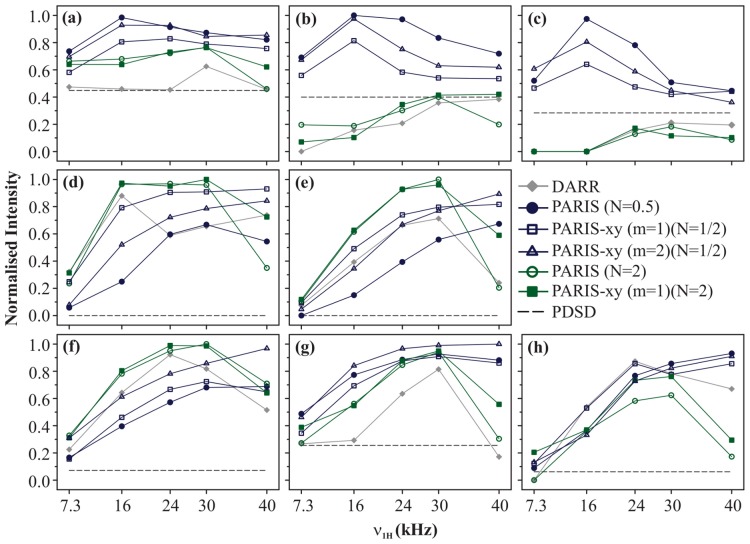
Figure 3. Build-up curves.
Magnetisation build-up curves of (a) C  -C
-C  , (b) C
  -C
-C  , (c) C
  -C
-C  , (d) C
  -C
-C  , (e) C
  -CO, (f) C
  -CO, (g) C
  -CO, and (h) C
  -C
-C  cross-peaks of U-13C-,15N-L-histidine
 H
H O for different recoupling schemes applied on the 1H channel, at
  = 30 kHz and
  = 16.43 T. Each recoupling scheme was applied for a fixed mixing-time period (90 ms) using different RF amplitudes of 7.3, 16, 24, 30, and 40 kHz.
  values calculated for individual cross-peaks according to Eq. 1 are plotted as a function of RF amplitude.
  values are normalised with respect to the maximum value yielded by PARIS (N = 1/2) (
 = 16 kHz) in (a, b, and c), PARIS-xy (m = 1)(N = 2) (
 = 30 kHz) in (d), PARIS (N = 2) (
 = 30 kHz) in (e and f), PARIS-xy (m = 2)(N = 1/2) (
 = 30 kHz) in (g), and PARIS (N = 1/2) (
 = 40 kHz) in (h). Data points are joined with straight lines to guide the readers' eyes.

