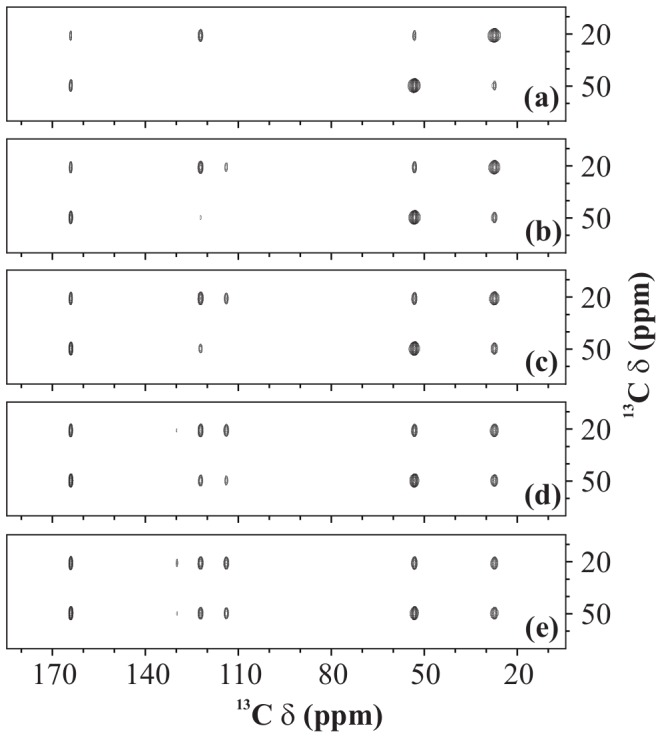
Figure 9. 13C-13C spectra.

2D 13C-13C spectrum of U-13C-,15N-L-histidine H
H O recorded using PARIS-xy (m = 1)(N = 1/2) recoupling scheme at
  = 11.74 T,
  = 30 kHz,
  = 16 kHz, and with (a) 10, (b) 20, (c) 40, (d) 80, and (e) 160 ms long mixing-time period.
