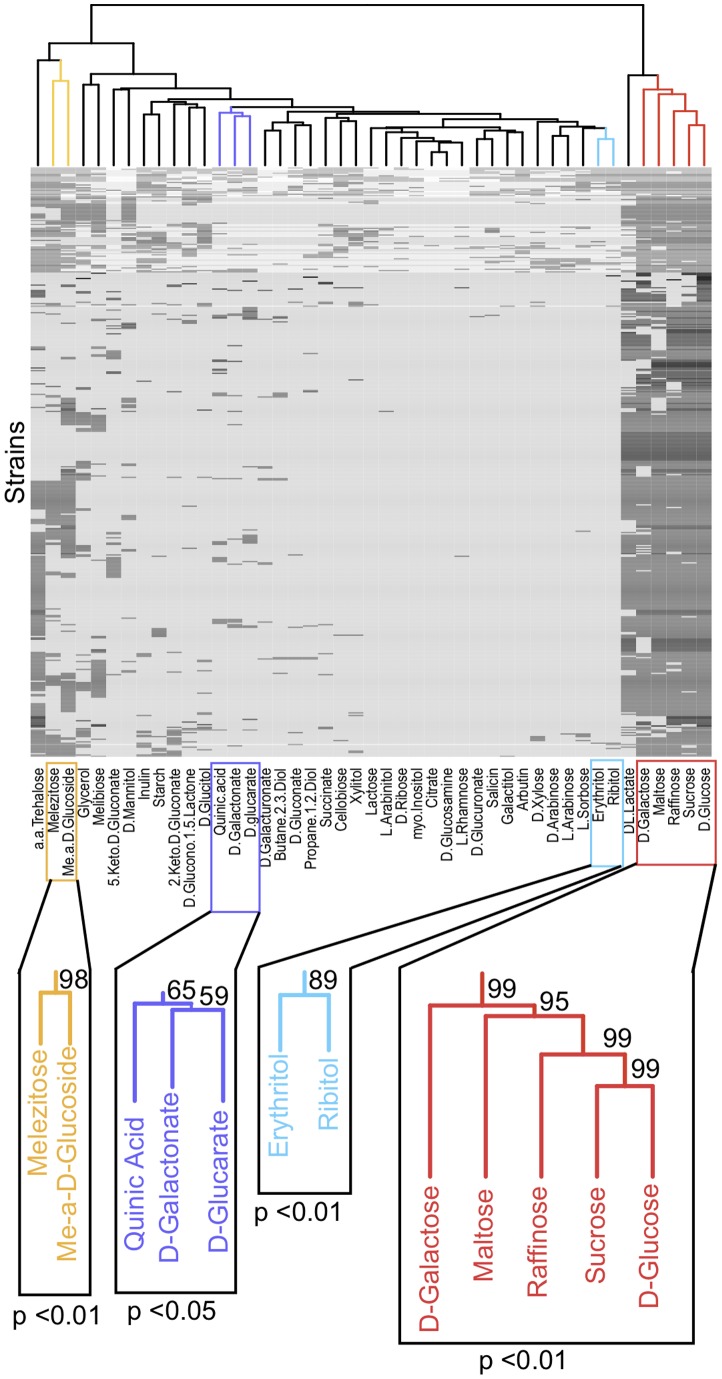
Figure 3. Nonrandom distribution of four clusters of carbon source utilization traits across strains.
The heat map shows the ability (black cells) or inability (grey cells) of each strain to utilize each carbon source. Missing data is indicated by white cells. Callout boxes indicate significant clusters of carbon sources according to multiscale bootstrap resampling. P-values and bootstrap support are provided for the significant clusters.

