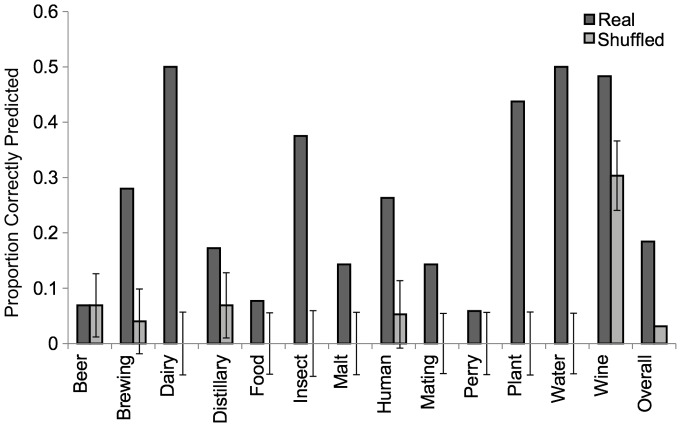
Figure 6. The substrate a strain was isolated from can be predicted based on the set of carbon sources a strain can utilize.
Dark gray bars represent the proportion of time that a substrate was correctly predicted. Lighter gray bars represent the background prediction rate and associated confidence intervals based on shuffled data. There was no predictive power for 6 substrates (not shown).

