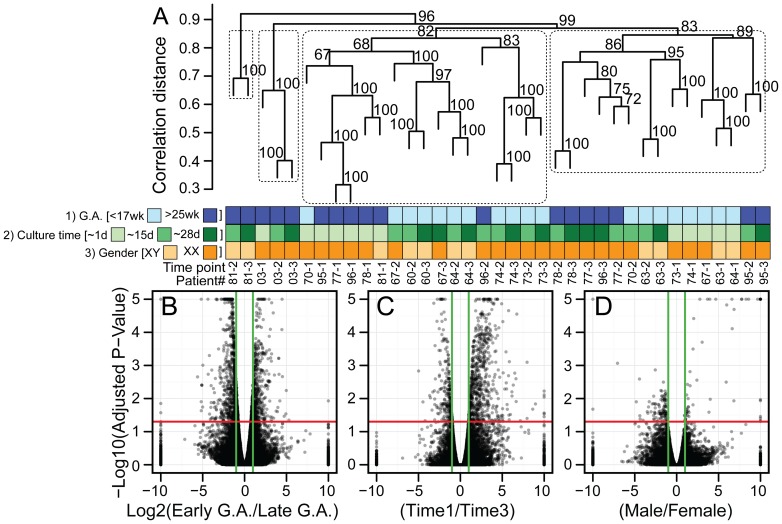
Figure 3. Amniocyte genome-wide transcriptional profile varies depending on GA and time in culture.
(A) Hierarchical clustering of 11 independent amniocyte isolates at different times in culture (37 RNA-seq datasets; 24,609 ensemble genes per dataset). Four major clusters correlate with gestational age and culture time since amniocentesis. (B–D) Volcano plots display the results of differential expression analyses using these three variables (n = 49,235 Ensembl genes). Genes plotted above the red line have adjusted p-values<0.05, and genes plotted outside of the green lines are >2-fold differentially expressed. Comparing (B) early vs. late gestational age revealed the most differentially expressed genes (n = 2,197), followed by (C) time in culture (n = 1039) and (D) gender (n = 208). (A, C) Culture time point T1 was taken on average from 1.3 days (0–8 range), T2 was taken on average from 15.2 days (13–22 range), and T3 was taken on average from 28.0 days (24–36 range).

