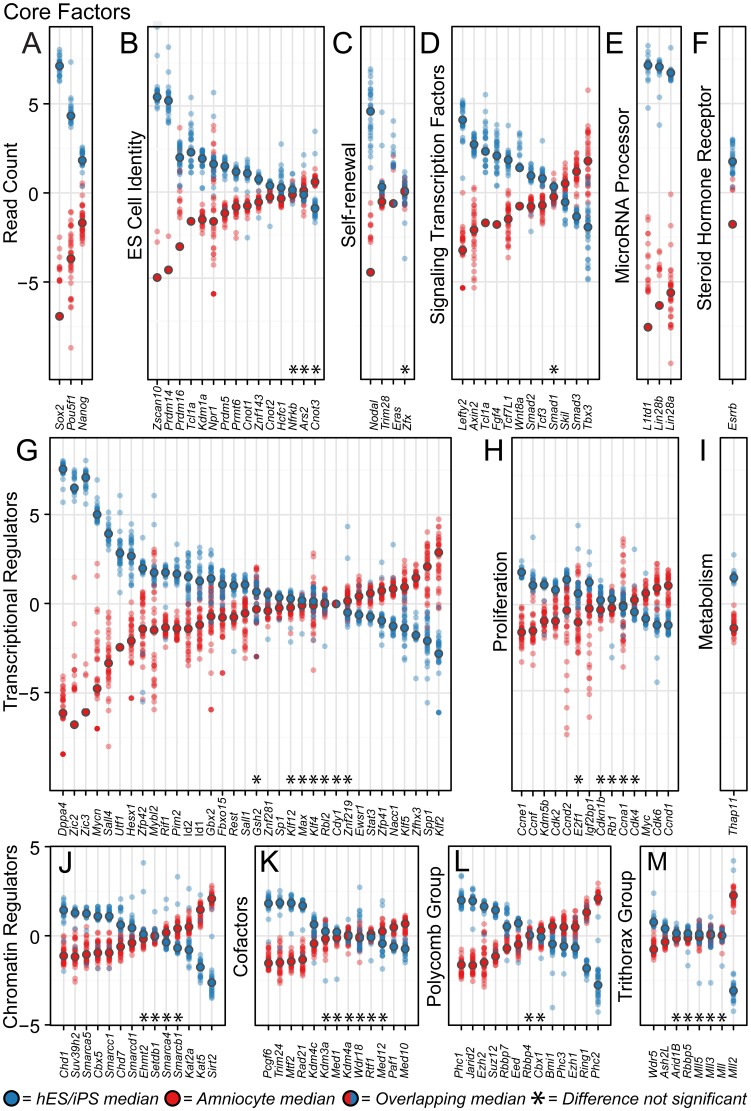
Figure 5. Amniocytes have a distinct transcriptional profile for key pluripotency genes.
(A–M) Differential expression analysis of RNA-seq datasets reveals the transcriptional profile controlling the stem cell state in amniocytes conspicuously differs from well-characterized ESC or iPSC lines. The selected 135 genes (Table S2) were grouped into transcriptional regulatory circuits based on their major functional role. Dot plots show RNA-seq read counts (variance corrected) that were median centered for 37 amniocyte (red dots) isolates and 31 ESC and iPSC replicates (blue dots). Circles outlined in black indicate the median value for each group. Within each panel, genes were sorted raw RNA-seq counts first by variance correction, second by the difference between the group medians [median (stem cell samples) – median (amniocyte samples)] and third by ordering the values from highest difference to lowest. All panels use the same y-axis scale, but unused portions of panels K-M were cropped (over +5 and under −5 read counts) because these areas were blank. Asterisks indicate genes with read counts that are not statistically different between amniocytes and ESC/iPSC (defined as the adjusted p-value is greater than 0.05).

