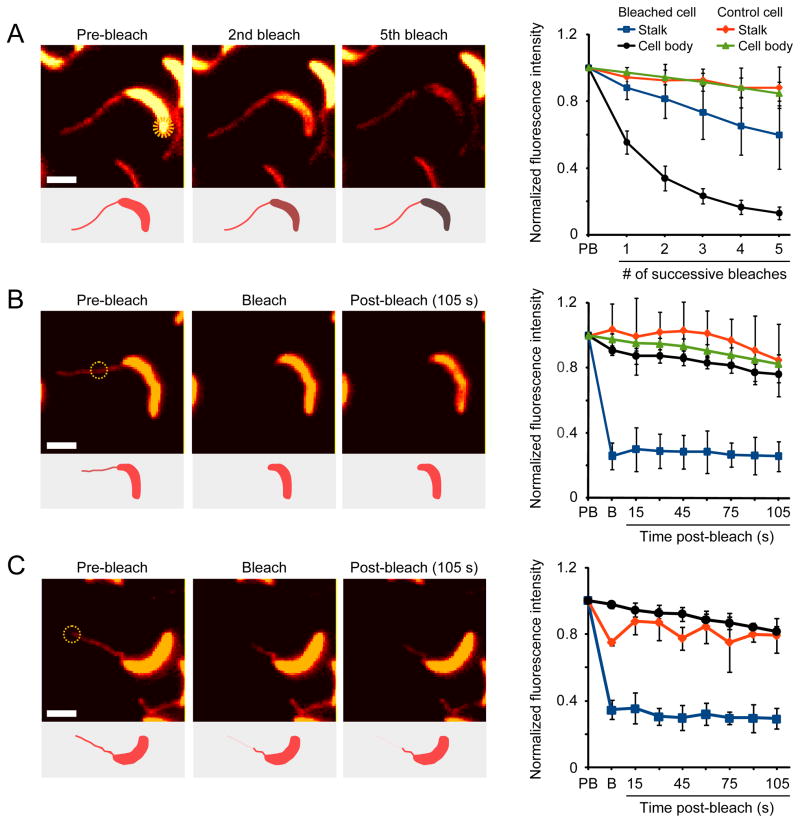
Figure 1. A diffusion barrier compartmentalizes the Caulobacter periplasm.
(A–C) Diffusion of a xylose-inducible PstS-mCherry fusion assayed using FLIP (A and C) and FRAP (B). Cells (EK363) were bleached with seven ~4 nsec pulses in the region indicated by yellow circles. Bleaching was performed either multiple times in succession (A) or once followed by a 105 sec recovery (B–C). Insets show schematic representations of the results, and graphs show the quantification of fluorescence in multiple cells (panel A: n = 6, p < 0.0002; panel B: n = 7, p < 2×10⁻⁷; panel C: n = 3, p < 0.002; error bars = SD). Fluorescence intensities were measured in the stalk (blue) and cell body (black) of the bleached cell or the stalk (red) and cell body (green) of a nearby control cell. For intra-stalk bleaching, the bleached (blue) and unbleached (red) portions of the stalk as well as the cell body (black) fluorescence were quantified. The color-maps of the fluorescent images were scaled for easier visualization. However, all quantifications were performed using raw image data. The fluorescence intensity of each region of interest was normalized to its pre-bleach intensity. Abbreviations: PB, pre-bleach; B, bleach. Scale bars: 2 μm. See also Figure S1.

