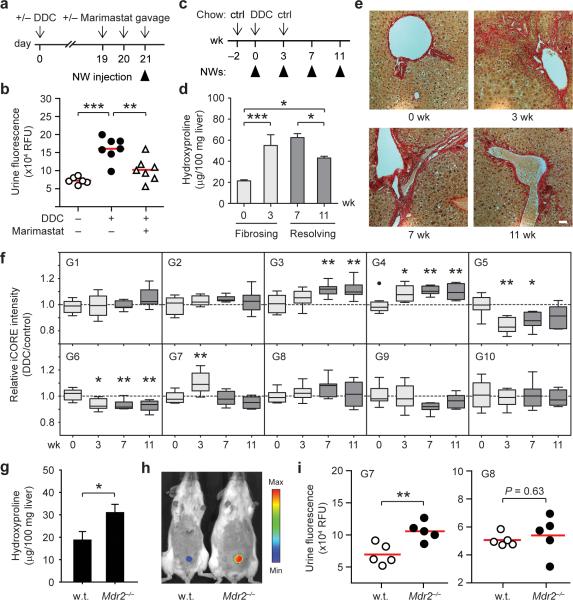
Figure 4. Urinary biomarkers of hepatic fibrosis and resolution in DDC-treated mice.
(a) Timeline for DDC and Marimastat treatment. (b) Urinary biomarker levels by α-FITC immunoprecipitation following G1–G10 administration (ANOVA, *** P < 0.001, ** P < 0.01). (c) Induction of fibrogenesis and resolution timeline. (d) Quantification of total liver collagen by hydroxyproline analysis. DDC treatment led to ~3 fold increase in liver collagen by week 3 (*** P < 0.001) and a ~30% reduction between week 7 and 11 (* P < 0.05) that remained above pretreatment values (* P < 0.05) (One-way ANOVA, Tukey post test, n = 3, s.e.m.). (e) Shown are Sirius Red staining of representative liver sections indicating the presence of fibrotic extensions emanating from portal triads at week 3, persisting to week 7 and reversing by 11 weeks. (scale bar = 50 μm) (f) Box and whisker plots of individual iCORE peak intensities plotted as DDC over control at 0, 3, 7 and 11 weeks (* P < 0.05, ** P < 0.01; repeated measures ANOVA, Tukey post test; n = 8–10). (g) Cross-validating G7 as a urinary biomarker of fibrosis in Mdr2−/− mice. Quantification of liver collagen by hydroxyproline analysis (* P < 0.05, n = 3). (h) IVIS fluorescence in vivo imaging of urinary responses in Mdr2−/− mice following NW infusion. (i) Administration of G7 led to elevations in urinary fluorescence while G8 did not track with fibrosis (** P < 0.01).

