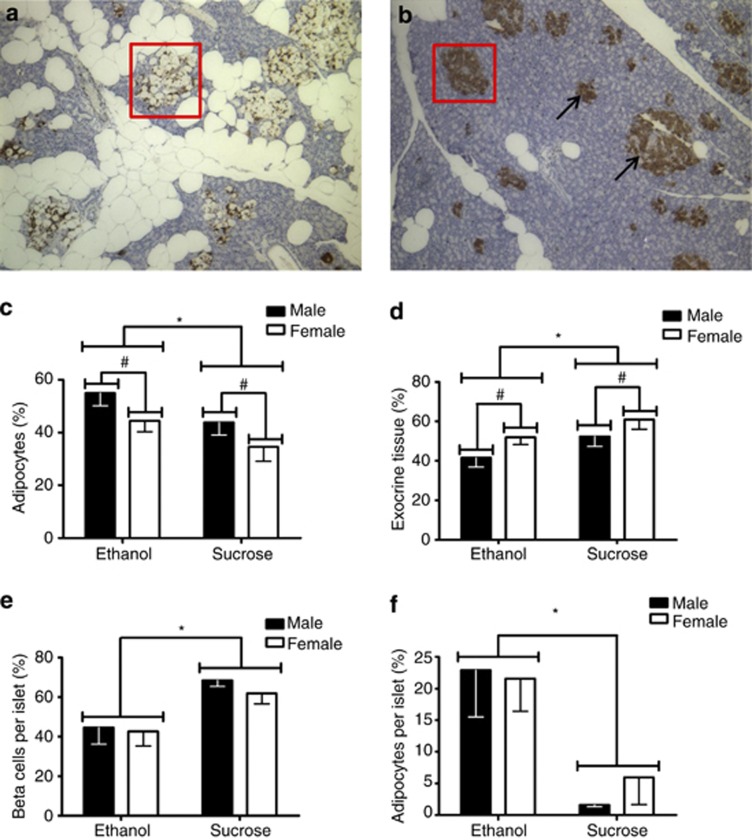
Figure 4.
Pancreatic morphology (PD150–200). The × 10 magnification of adipocyte infiltration in islets and surrounding tissue in a CPEE (ethanol) animal (a). Pancreatic tissue from a nutritional control (sucrose) animal is shown at × 10 magnification (b). Ethanol offspring had increased adipocytes (c) and decreased exocrine tissue (d) in the lobular pancreas compared with sucrose offspring (*P<0.05). Male offspring had increased adipocytes and decreased exocrine tissue compared with female offspring (#P<0.05). The data are presented as group mean±s.e.m. of the offspring of each maternal treatment group with offspring from paired litters: ethanol (n=15 offspring; 7 males, 8 females) and sucrose (n=13 offspring; 7 males, 6 females). Pancreatic islet cell distribution (PD150–200) (boxed in red in a, b). Within each islet, CPEE (ethanol) offspring had fewer insulin-producing β-cells (arrows) (e) and more adipocytes (f) than nutritional control (sucrose) animals (P<0.05). The data are presented as group mean±s.e.m. of the offspring of each maternal treatment group with offspring from paired litters: ethanol (n=19 offspring; 10 males, 9 females) and sucrose (n=20 offspring; 10 males, 10 females).

