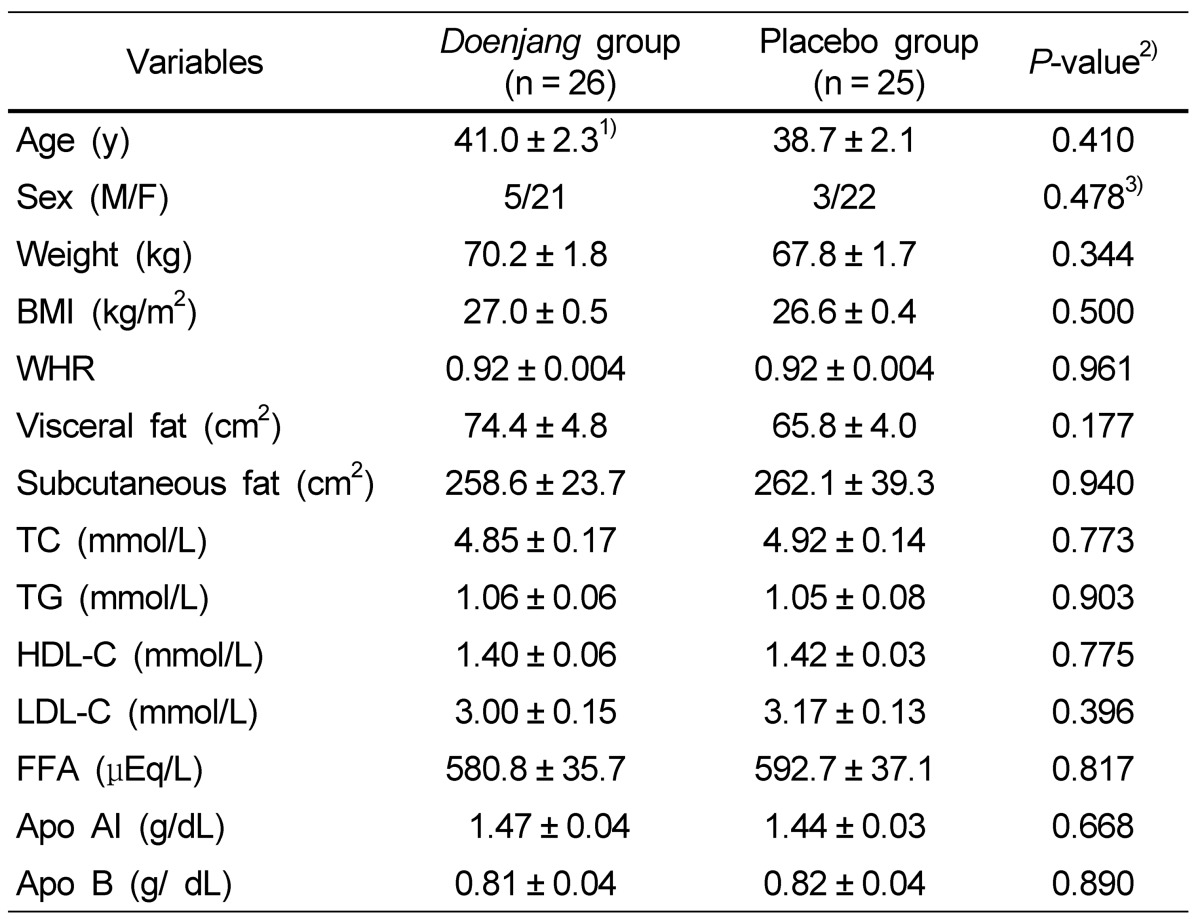
Table 2.
Baseline characteristics of the subjects
1)Values are expressed as means ± SE.
2)By independent t test
3)Chi-square test
BMI, body mass index; WHR, waist to hip ratio; TC, total cholesterol; TG, triglyceride; HDL-C, high density lipoprotein cholesterol; LDL-C, low density lipoprotein cholesterol; FFA, free fatty acid; Apo AI, Apolipoprotein AI; Apo B, Apolipoprotein B.

