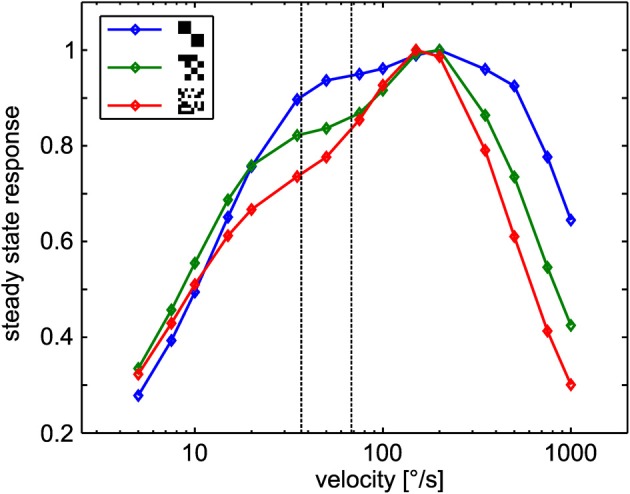
Figure 5.

Steady-state tuning of the sensory module. EMD responses to constant angular velocity stimulation for the different textures. Data was normalized to maximum response obtained with each texture. The dotted lines indicate the retinal velocity range in the center of the receptive fields of the simulated neurons in the middle of the intersaccadic segment of the outmost trajectory (see text for details).
