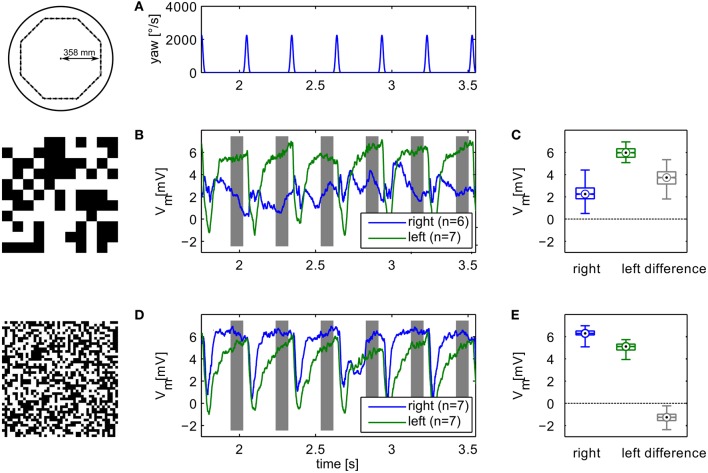
Figure 6.
Example of electrophysiological recordings. Left column (B,D) shows membrane potential changes relative to the resting potential of the cell obtained with the different textures. Top panel shows the yaw velocity timecourse (A). Right column (C,E) shows boxplots of the responses in the analysis windows indicated in grey in the time-courses. The boxplots show median (black dot), quartiles (box), and the range of the data (whiskers). Non-overlapping notches indicate significant difference between two medians at a 5% significance level. Compare to model responses shown in Figure 3.

